
Sunny Side of the Street
HOT LINKS:
Indicators | Webinars | Lectures | Solving the Puzzle | Enter Your Own Comment | See QnAs (Questions & Answers)
Market Predictions Made Easy
ISSUE 14.1 Nov 14, 2014
This is the inauguration issue of this Opt-In newsletter. The advice is free. Everything I say is for educational purposes only. That said, I will be using my SunnyBands proprietary indicator to give you exact readings of the bands and where they are within several market symbols.
The symbols I use will be of two kinds: (a) the Dow, & S&P 500 eMini, and (b) the top 5 PHW stocks. This will hold true for every newsletter. Of course, the stocks will change on a weekly or monthly basis, depending on which 5 stocks sort to the top of the list. If you want to know about my PHW indicator, you can read Chapter 6 of my Users' Manual. If you want to know about SunnyBands, you can study Chapter 5 of my Users' Manual.
If you would like to get this newsletter for FREE every week, all you have to do is sign up (by clicking the button) and filling in your information. Sunny will take readings from her proprietary SunnyBands and interpret them for you, on the Dow, EMini and the top 3 PHW stocks.
![]()
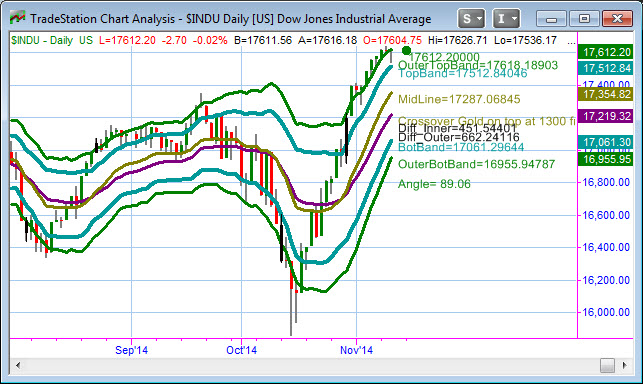
Today's Readings from SunnyBands on $INDU
The main indicator of market health is the Dow Jones 30 Industrial Index ($INDU). We all know what the value of the Dow is, and in fact it is announced on every news channel, every day. Today's closing value is 17634.74 . It is within 10 points of the all-time high. And, from the configuration of the SunnyBands, it looks like we could be ready to make a move to the downside. Logically I would expect the market to run to 18,000, but when I see a hammer candle penetrate the OuterUpper SunnyBand it tells me to go short..
TOP PHW STOCKS
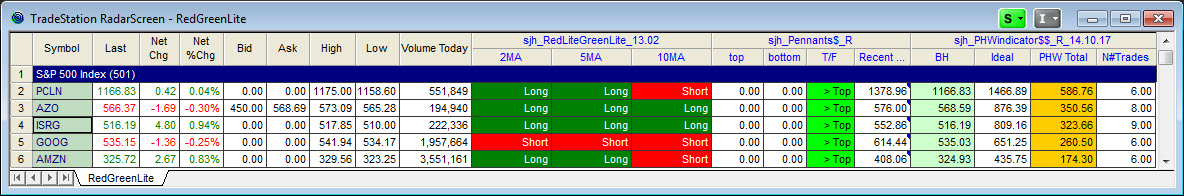
What is PHW? One of my proprietary indicators, PHW stands for Potential Hourly Wage. It is a way to tell whether a stock (or commodity) is tradable. Are there enough ups and downs to actually make more money trading than using buy-and-hold. When applied to a RadarScreen list of many stocks, PHW allows you to sort the applicable column and determine which stocks are the most tradable. For instance, here is a RadarScreen sort: (NOTE: the Yellow column shows the PHW sort. The red & green columns are from the RedLiteGreenLite indicator, and the green column with">Top" in it is the Pennants indicator. Each has its own use, which is explained in the Documentation).
PCLN
PCLN went long as the green candle penetrated the outer lower SunnyBand, turning green. Subsequently, after only 3 bars, it touched the DMA Midline and we went short. We are waiting for price to touch the lower outer band and we will look for profits at that point...
AZO
AZO is strongly upward with a series of green candles. It hasn't yet penetrated the upper outer SunnyBand, showing continuing strength. Stay long.
ISRG
ISRG shows strength by continuing on upward through the top outer SunnyBand. There are 5 upward green candles in a row, without a reversing red candle. Stay long.
STAY TUNED
Next week I will send another FREE weekly newsletter. Be sure you have signed up to receive the email.