
"The Sunny Side of the Street"

UPCOMING SEMINARS, see below.
| NAVIGATION: | |||
|
|
|||
Last week's stock picks in the model portfolio made over $9000 profits. The long trade on the QQQs at the end of the week made $5,750 in the model portfolio, and the short trade in the beginning made $3,025. We got beat up in some sideways whipsaws for a loss of nearly $8,000. So, the total profit for the week in the model portfolio comes to $9,775. All in all a pretty good week.
The long-term model is still short, and will be until compelling evidence says we are changing direction. The short-term model is long, still riding the Ths-Fri move up. Take profits on that one if it drops below 825.87 on the S&P or 21.68 on the QQQs.
Watch the weekend stock picks carefully for moves above the breakout points, and take profits when you see them.
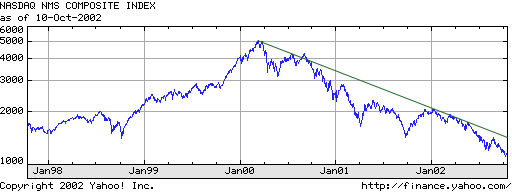 |
Could still be in downtrend because of overhead trendline, regardless of recent big moves. |
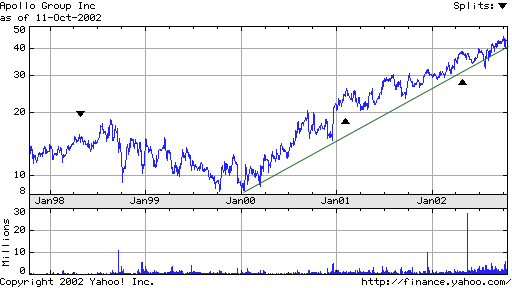 |
Has shown strength all through this bear market, but is just now beginning to weaken. |
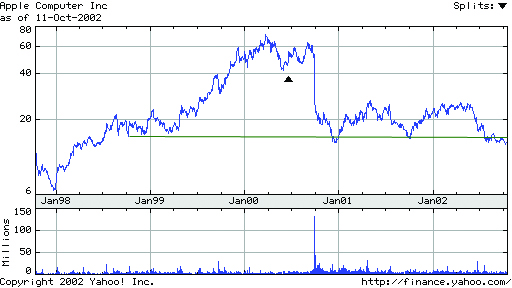 |
Could result in a seasonal rally back up to Feb highs. |
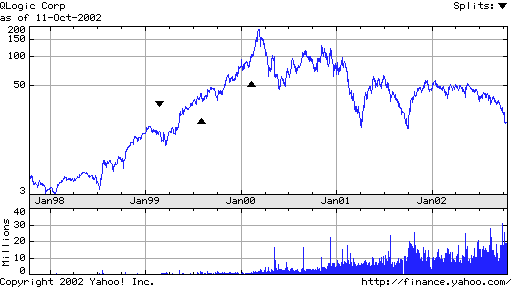 |
Potential seasonal low. Watch for a breakout above 25 before considering buying. |
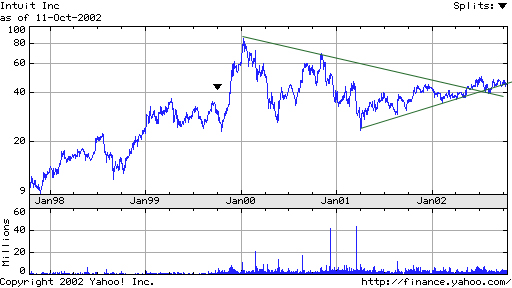 |
Has broken a long-term wedge to the upside. Positive sign for continued up movement. Look for a breakout of 50. |
|
NOTE: As a Platinum Zone member, you may call Sunny at (760) 930-1050 if you have any questions about terms used herein. Please speak up over the answering machine and she will pick up, if she's in the office. CommentarySUNDAY NIGHT, OCT 13, 2002:
SUNDAY NIGHT 10/13/2002 ( for FRIDAY 10/11/2002): INDU (DOW JONES INDUSTRIAL AVERAGE): I have been asked by several to keep my analysis simpler and easier to understand. So, here we go on a new tact. Once again, as we have been saying over the past week, the 2 overlying cycles are pulling the market upward. This pull will continue for another two months or so, taking the market upward with it. Last night I suggested that wave 5 of the Elliott wave count could take us to 7668 on the Dow today. Boy, was I right, but way short of the ultimate target at 7850! But of course, we stayed long for the ride, because there was nothing compelling us to do otherwise. Remember, follow the trend and don’t trade just for the sake of trading. Wait until something in the market compels you to be a buyer or a seller. Compelling things are like moving averages crossing over, or trendlines being broken, or support & resistance being violated. We started the morning with a great gap up and continued on through solidly until we had a slight correction beginning about 11amPT. By our timing model, available only to subscribers, we have been long since 10:15amPT on 10/10 (yesterday), on our short-term model. On the long-term model, we are still short, in spite of today’s huge upward action, and will stay short (long-term) until the long-term trend line downward is broken to the upside. A break of 24.40 to the upside on the QQQs or a solid break above 9500 on the Dow would be a compelling reason to go long. Barring that evidence, as long-term traders we will stay short. On the other hand, short-term traders will continue to play both the long and the short side of the market with quick intraday plays. Do not make the mistake of thinking that Friday’s action was the end of all downside action on the Dow and the beginning of a new bull market. While it could be, we always wait for compelling evidence to stick our necks out and put our money at risk. So what if you miss the first few points of a new bull run, if it is really a new bull market it will continue for quite some time and there will plenty of profits for all. QQQs The daily QQQ broke above my sjh_DMA (Dynamic Moving Average) on a gap this morning. It finished the afternoon just touching the top band on my SunnyBands. The long-term downsloping trendline is just above the upper band, and it would not be surprising to see the market reach for and try to test that trendline. My expectation would be for the QQQ to make a run for the bottom of the trendline before showing the Elliott fourth wave correction. That would put the QQQ at about 23. If it continues on upward through that line, hang on to your long positions! If it stumbles and back tracks, that would be a good time to take profits. You can always get in again when the QQQ proves itself by going solidly above the trendline, forming a new upward trendline. Even with the great push upward, the RSI on the daily QQQ chart did not penetrate 65, so we still have some room to go on upward if this is indeed a bullish move. Looking at the short-term chart of the QQQs is another story. RSI not only penetrated 65, but stayed there for quite a while (about 5 hours), before taking a tumble and then bouncing right back up to 63.45. That’s a very bullish sign for the intraday QQQs. Average True Range has been vacillating back and forth on the daily chart between 0.75 and 1.50. Each time the ATR gets to one extreme, the market reverses and goes the other direction for a short time. This indicator gave us a hint of turning upward as early as late September, and now ATR sits at 0.96. That speaks to a continued move on upward on the daily chart. If you are game to play the long-term chart for a several day move up, just to pick up some pocket change, the Attractor by my calculation is sitting overhead at 24.40, so that’s about 2 points on the QQQ. Also, if that happens we will break the downsloping trend line, and be in for a new market direction. On the short-term QQQ chart, the next attractor upward is at 22.50, and that looks like a pretty safe bet, considering the momentum behind the move of the last two days. Be nimble, though, as it might touch it and rebound right off sharply. If so, it would likely head back down to the Attractor at 21.68. SUGGESTION BOX If you have any suggestions about what you would like to see more of, or less of, or something entirely different in this commentary, please share them with me. I am new to newsletter writing and want to give the best information possible to my constituents. Feel free to email sunny@moneymentor.com anytime. UPCOMING SEMINARSI have decided to give two more seminars this spring. One will be my well-known “Solving the Puzzle” seminar, to be held in Carlsbad, CA January 17-19, 2003. In this seminar we pull all of the various elements of learning how to become a successful trader into one comprehensive plan. I will be opening the group only to 15 people, and the price will be $2,995. If you enroll now, the early bird discount (until October 31) will be just $1,995. To view the agenda of the seminar, click on www.moneymentor.com/SFClassesx.htm . And, for those of you TradeStation users, or hopeful users, I will be giving another “TradeStation Made Easy” class on the weekend of February 7-9, 2003. Same pricing plan as above. Agenda for the class is available at www.moneymentor.com/TSMadeEasy.htm .
|
|||||||||||||||||||||||||||||||||||||||||||||||||||||||||||||||||||||||||||||||||||||||||||||||||||||||||||||||
| NAVIGATION: | |||||||||||||||||||||||||||||||||||||||||||||||||||||||||||||||||||||||||||||||||||||||||||||||||||||||||||||||
|
|
|||||||||||||||||||||||||||||||||||||||||||||||||||||||||||||||||||||||||||||||||||||||||||||||||||||||||||||||
|
How Did We Do? Weekend Stock Alerts
This week's (10/13/02) Sunny Side of the Street Weekend Stock Alerts:
The premium levels of membership to "The Sunny Side of the Street" get more details, more commentary and more charts. The Gold and Platinum levels get access to intraday analysis. If you are interested, give us a call at (760) 930-1050. State your name over the answering device, and if she's not in the middle of a trade Sunny will pick up and talk with you personally. If she's not immediately available, Sunny will call you back as soon as she can, so please leave your name and state your phone number slowly. Thanks! The passwords to the premium zones change every day, and you will receive it by email with your notification that the commentary has been posted. You must be a subscriber to view the Platinum and Pay-per-view zones. |
|||||||||||||||||||||||||||||||||||||||||||||||||||||||||||||||||||||||||||||||||||||||||||||||||||||||||||||||
DISCLAIMERS:
Statistics, tables, charts and other information on trading
system monthly performance is hypothetical unless otherwise specified, and is
based on the referenced systems hypothetical monthly performance as it would be
executed through TradeStation Securities if per the contract/account balance and
other specifications noted in the performance tables. Actual dollar and
percentage gains/losses experienced by investors would depend on many factors
not accounted for in these hypothetical statistics, including, but not limited
to, starting account balances, market behavior, incidence of split fills and
other variations in order execution, and the duration and extent of individual
investor participation in the specified system. Fees, commissions, and other
expenses are not accounted for herein, and will affect investors net results in
actual trading. While the information and statistics given are believed to be
complete and accurate, given the hypothetical specifications, we cannot
guarantee their completeness or accuracy. THIS INFORMATION IS PROVIDED FOR
EDUCATIONAL/ INFORMATIONAL PURPOSES ONLY. These results are not indicative of,
and have no bearing on, any individual results that may be attained by the
trading system in the future. PAST OR HYPOTHETICAL PERFORMANCE IS NOT INDICATIVE
OF FUTURE RESULTS.
The CFTC requires the following disclosure statement in reference to
hypothetical results:
HYPOTHETICAL PERFORMANCE RESULTS HAVE MANY INHERENT LIMITATIONS, SOME OF WHICH
ARE DESCRIBED BELOW. NO REPRESENTATION IS BEING MADE THAT ANY ACCOUNT WILL OR IS
LIKELY TO ACHIEVE PROFITS OR LOSSES SIMILAR TO THOSE SHOWN; IN FACT, THERE ARE
FREQUENTLY SHARP DIFFERENCES BETWEEN HYPOTHETICAL PERFORMANCE RESULTS AND THE
ACTUAL RESULTS SUBSEQUENTLY ACHIEVED BY ANY PARTICULAR TRADING PROGRAM. ONE OF
THE LIMITATIONS OF HYPOTHETICAL PERFORMANCE RESULTS IS THAT THEY ARE GENERALLY
PREPARED WITH THE BENEFIT OF HINDSIGHT. IN ADDITION, HYPOTHETICAL TRADING DOES
NOT INVOLVE FINANCIAL RISK, AND NO HYPOTHETICAL TRADING RECORD CAN COMPLETELY
ACCOUNT FOR THE IMPACT OF FINANCIAL RISK OF ACTUAL TRADING. FOR EXAMPLE, THE
ABILITY TO WITHSTAND LOSSES OR TO ADHERE TO A PARTICULAR TRADING PROGRAM IN
SPITE OF TRADING LOSSES ARE MATERIAL POINTS WHICH CAN ALSO ADVERSELY AFFECT
ACTUAL TRADING RESULTS. THERE ARE NUMEROUS OTHER FACTORS RELATED TO THE MARKETS
IN GENERAL OR TO THE IMPLEMENTATION OF ANY SPECIFIC TRADING PROGRAM WHICH CANNOT
BE FULLY ACCOUNTED FOR IN THE PREPARATION OF HYPOTHETICAL PERFORMANCE RESULTS
AND ALL WHICH CAN ADVERSELY AFFECT TRADING RESULTS.
These trading systems, like any other, may involve an inappropriate level of
risk for prospective investors. THE RISK OF LOSS IN TRADING COMMODITY FUTURES
AND OPTIONS CAN BE SUBSTANTIAL AND MAY NOT BE SUITABLE FOR ALL INVESTORS. Prior
to purchasing a trading system from this or any other system vendor or investing
in a trading system with a registered commodity trading representative,
investors need to carefully consider whether such trading is suitable for them
in light of their own specific financial condition. In some cases, futures
accounts are subject to substantial charges for commission, management,
incentive or advisory fees. It may be necessary for accounts subject to these
charges to make substantial trading profits to avoid depletion or exhaustion of
their assets. In addition, one should carefully study the accompanying
prospectus, account forms, disclosure documents and/or risk disclosure
statements required by the CFTC or NFA, which are provided directly by the
system vendor and/or CTA's.
The information contained in this report is provided with the objective of
"standardizing" trading systems performance measurements, and it is intended for
educational /informational purposes only. All information is offered with the
understanding that an investor considering purchasing or leasing a system must
carry out his/her own research and due diligence in deciding whether to purchase
or lease any trading system noted within or without this report. This report
does not constitute a solicitation to purchase or invest in any trading system
which may be mentioned herein. SUNNY HARRIS & ASSOCIATES, INC, SUNNY HARRIS
and/or DOYEN CAPITAL MANAGEMENT MAKE NO ENDORSEMENT OF THIS OR ANY OTHER
TRADING SYSTEM NOR WARRANTS ITS PERFORMANCE. THIS IS NOT A SOLICITATION TO
PURCHASE OR SUBSCRIBE TO ANY TRADING SYSTEM.