"The Sunny Side of the Street"

Remember: only 1000 people will ever be allowed to subscribe to the Platinum Zone. The only way to get a spot after that, will be for someone else to drop out. (That number includes free and gratis accounts to the media, etc...) Subscribe now and get the first three months at a discount...only $99.95/mo. Regularly $139.95/mo.
| NAVIGATION: | ||
|
|
||
| CHARTS OF INTEREST FOR THIS COMMENTARY | |||||||||||||||||||||||||||||||||||||||||||||||||||||||||||||||||||||||||||||||||||||||||||||||||||||||||||||||
| QQQ | QQQ | QQQ | |||||||||||||||||||||||||||||||||||||||||||||||||||||||||||||||||||||||||||||||||||||||||||||||||||||||||||||
|
1 Day |
5 Days |
 1 Year |
|||||||||||||||||||||||||||||||||||||||||||||||||||||||||||||||||||||||||||||||||||||||||||||||||||||||||||||
 |
 |
||||||||||||||||||||||||||||||||||||||||||||||||||||||||||||||||||||||||||||||||||||||||||||||||||||||||||||||
| Figure 1 | Figure 2 | ||||||||||||||||||||||||||||||||||||||||||||||||||||||||||||||||||||||||||||||||||||||||||||||||||||||||||||||
|
NOTE: As a Platinum Zone member, you may call Sunny at (760) 930-1050 if you have any questions about terms used herein. CommentarySUNDAY NIGHT--OCT 27, 2002: GENERALOnly two of our stock picks for the week past were triggered. On 1000 share purchases, neither met their stated goals, but instead lost 1 cent each for the week, giving us a total loss of $20 on stock purchases. INDU (Dow Jones 30 Industrials):[Analysis of the INDU includes, by its very
nature, analysis of the DIAs. Attractors are given for both.]
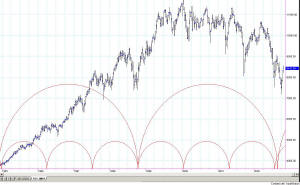
The Attractors are drawn on the chart in Figure 2.
You can see that the daily upward movement has been stopped each time for
the past 5 bars by the Attractor at the 8530 level. Today we
continued with the broadening formation we mentioned in yesterday's
commentary, but the closing price was at
QQQs:
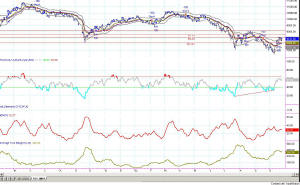
On the daily chart (Figure 3) we are still below the cyan uptrend line that we drew last week. That's disappointing from the emotional side. Technically, however, we are still pushing up on the top Sunny_Band and RSI is still right below the bullish range, clocking out at 62.98. We want to see a push upward taking the RSI into 65+ territory, and we should because of the overlapping cycle theory. ADX is rising nicely, showing us that we are in a trend, and the moving averages tell us it is an uptrend--as if we couldn't tell by looking. The ATR is still below 1 point per day, and I would like to see it move higher for those of us who prefer trading over investing. Our buy signal on the daily QQQ has been in force since 10/18 at 23.81, for a current profit of $4,050. That pretty nice, but I'm starting to become antsy and want to see it move more than that. You can see from the chart in Figure 3 that we continue to bang our heads up against the Attractor at 24.40, though we did push slightly through it today, with the close being near the top of the bar's range. That's a positive sign. The next daily Attractor is at 26.19 and we should see that next week. On the intraday chart (15-minutes) we went into a buy signal at 11:30amPT on the model. Our previous instructions had been to ignore the short, as I thought it was just going to be a whipsaw, and it was indeed. So, in reality we have been long since the preceeding buy signal on the model at 11:30amPT on 10/23 at 24.33. So, we have a little bit of profit in that trade instead of two whipsaw losses. In Figure 4 you can observe an interesting phenomenon along with me. Each morning the ATR peaks at about 9:30amPT and then begins to diminish for the remainder of the day. What does that mean? I think I'll do a few studies on it this weekend to see if there is any "time of day" constraints that we can use to improve our trading. If you have any thoughts, please feel free to share them in the commentary box below. Meanwhile, the next overhead Attractor is at 24.88 and we should see that price on Monday. (Unless, of course, there is some kind of world catastrophe. (I'll hence forth refer to this caveat as UWC.) The Attractor below us, which we will use as a Stop Loss or an excuse to go short is at 23.75. Don't jump the gun on this one, however, as we have touched it several times without going below it. SPoos:
Long Term: 950.00 and 911.50 are looming overhead, pulling the SPoos upward. 855 is below us and should act as support. Very long-term, it looks like we could be headed for a move on up to about 1049, of course chopping along the way. Both the long-term and the short-term SPoos models are in buy position. Stock Picks:Watch the table below. Stocks are picked on Sunday nights and are to be exited at (a) the stop loss, or (b) the goal, or (c) before Friday afternoon.
|
|||||||||||||||||||||||||||||||||||||||||||||||||||||||||||||||||||||||||||||||||||||||||||||||||||||||||||||||
| NAVIGATION: | |||||||||||||||||||||||||||||||||||||||||||||||||||||||||||||||||||||||||||||||||||||||||||||||||||||||||||||||
|
|
|||||||||||||||||||||||||||||||||||||||||||||||||||||||||||||||||||||||||||||||||||||||||||||||||||||||||||||||
Weekend Stock Alerts
This week's (10/28/02) Sunny Side of the Street Weekend Stock Alerts:
The premium levels of membership to "The Sunny Side of the Street" get more details, more commentary and more charts. The Platinum Zone gets access to intraday analysis and real-time alerts. If you are interested, give us a call at (760) 930-1050. (Or, simply order here.) State your name over the answering device, and if she's not in the middle of a trade Sunny will pick up and talk with you personally. If she's not immediately available, Sunny will call you back as soon as she can, so please leave your name and state your phone number slowly. Thanks! The passwords to the premium zones change every day, and you will receive it by email with your notification that the commentary has been posted. You must be a subscriber to view the Platinum and Pay-per-view zones. |
|||||||||||||||||||||||||||||||||||||||||||||||||||||||||||||||||||||||||||||||||||||||||||||||||||||||||||||||
DISCLAIMERS:
Statistics, tables, charts and other information on trading
system monthly performance is hypothetical unless otherwise specified, and is
based on the referenced systems hypothetical monthly performance as it would be
executed through TradeStation Securities if per the contract/account balance and
other specifications noted in the performance tables. Actual dollar and
percentage gains/losses experienced by investors would depend on many factors
not accounted for in these hypothetical statistics, including, but not limited
to, starting account balances, market behavior, incidence of split fills and
other variations in order execution, and the duration and extent of individual
investor participation in the specified system. Fees, commissions, and other
expenses are not accounted for herein, and will affect investors net results in
actual trading. While the information and statistics given are believed to be
complete and accurate, given the hypothetical specifications, we cannot
guarantee their completeness or accuracy. THIS INFORMATION IS PROVIDED FOR
EDUCATIONAL/ INFORMATIONAL PURPOSES ONLY. These results are not indicative of,
and have no bearing on, any individual results that may be attained by the
trading system in the future. PAST OR HYPOTHETICAL PERFORMANCE IS NOT INDICATIVE
OF FUTURE RESULTS.
The CFTC requires the following disclosure statement in reference to
hypothetical results:
HYPOTHETICAL PERFORMANCE RESULTS HAVE MANY INHERENT LIMITATIONS, SOME OF WHICH
ARE DESCRIBED BELOW. NO REPRESENTATION IS BEING MADE THAT ANY ACCOUNT WILL OR IS
LIKELY TO ACHIEVE PROFITS OR LOSSES SIMILAR TO THOSE SHOWN; IN FACT, THERE ARE
FREQUENTLY SHARP DIFFERENCES BETWEEN HYPOTHETICAL PERFORMANCE RESULTS AND THE
ACTUAL RESULTS SUBSEQUENTLY ACHIEVED BY ANY PARTICULAR TRADING PROGRAM. ONE OF
THE LIMITATIONS OF HYPOTHETICAL PERFORMANCE RESULTS IS THAT THEY ARE GENERALLY
PREPARED WITH THE BENEFIT OF HINDSIGHT. IN ADDITION, HYPOTHETICAL TRADING DOES
NOT INVOLVE FINANCIAL RISK, AND NO HYPOTHETICAL TRADING RECORD CAN COMPLETELY
ACCOUNT FOR THE IMPACT OF FINANCIAL RISK OF ACTUAL TRADING. FOR EXAMPLE, THE
ABILITY TO WITHSTAND LOSSES OR TO ADHERE TO A PARTICULAR TRADING PROGRAM IN
SPITE OF TRADING LOSSES ARE MATERIAL POINTS WHICH CAN ALSO ADVERSELY AFFECT
ACTUAL TRADING RESULTS. THERE ARE NUMEROUS OTHER FACTORS RELATED TO THE MARKETS
IN GENERAL OR TO THE IMPLEMENTATION OF ANY SPECIFIC TRADING PROGRAM WHICH CANNOT
BE FULLY ACCOUNTED FOR IN THE PREPARATION OF HYPOTHETICAL PERFORMANCE RESULTS
AND ALL WHICH CAN ADVERSELY AFFECT TRADING RESULTS.
These trading systems, like any other, may involve an inappropriate level of
risk for prospective investors. THE RISK OF LOSS IN TRADING COMMODITY FUTURES
AND OPTIONS CAN BE SUBSTANTIAL AND MAY NOT BE SUITABLE FOR ALL INVESTORS. Prior
to purchasing a trading system from this or any other system vendor or investing
in a trading system with a registered commodity trading representative,
investors need to carefully consider whether such trading is suitable for them
in light of their own specific financial condition. In some cases, futures
accounts are subject to substantial charges for commission, management,
incentive or advisory fees. It may be necessary for accounts subject to these
charges to make substantial trading profits to avoid depletion or exhaustion of
their assets. In addition, one should carefully study the accompanying
prospectus, account forms, disclosure documents and/or risk disclosure
statements required by the CFTC or NFA, which are provided directly by the
system vendor and/or CTA's.
The information contained in this report is provided with the objective of
"standardizing" trading systems performance measurements, and it is intended for
educational /informational purposes only. All information is offered with the
understanding that an investor considering purchasing or leasing a system must
carry out his/her own research and due diligence in deciding whether to purchase
or lease any trading system noted within or without this report. This report
does not constitute a solicitation to purchase or invest in any trading system
which may be mentioned herein. SUNNY HARRIS & ASSOCIATES, INC, SUNNY HARRIS
and/or DOYEN CAPITAL MANAGEMENT MAKE NO ENDORSEMENT OF THIS OR ANY OTHER
TRADING SYSTEM NOR WARRANTS ITS PERFORMANCE. THIS IS NOT A SOLICITATION TO
PURCHASE OR SUBSCRIBE TO ANY TRADING SYSTEM.