
"The Sunny Side of the Street"
Remember: only 1000 people will ever be allowed to subscribe to the Platinum Zone. The only way to get a spot after that, will be for someone else to drop out. (That number includes free and gratis accounts to the media, etc...) Subscribe now and get the first three months at a discount...only $99.95/mo. Regularly $139.95/mo.
NAVIGATION:
- Platinum Zone (members only)
- Bronze Zone
- Free
- Only analyzes the Dow Jones daily chart
- Take me there
CHART OVERVIEW: for the real scoop, visit Yahoo Finance
|
1 Day |
5 Days |
 1 Year |
Commentary
MONDAY NIGHT--OCT 28, 2002:
Today was a good day for shorting. Subscribers got intraday alerts and profit opportunities.
INDU - DOW JONES INDUSTRIALS
Today's market (QQQs, SP, and INDU all three) was dull as dishwater. Trading was very slow and the market only moved 76 points. The INDU appears to be playing around with the Attractor at 8526, unable to make up its mind whether to commit and move on up, or give up and go further down.
 The
media is focusing on next week's Greenspeak day, believing that the Fed is
likely to cut interest rates. I don't think they will do anything.
If not, that will have a negative effect on the market, and that's why we
are moving shakily at the moment. Fear of commitment.
The
media is focusing on next week's Greenspeak day, believing that the Fed is
likely to cut interest rates. I don't think they will do anything.
If not, that will have a negative effect on the market, and that's why we
are moving shakily at the moment. Fear of commitment.
I stand by my previous conviction that the market will continue on upward for another two-three weeks. But, on days like today, I can't ignore the shorting opportunities, even if my longer term conviction is upward.
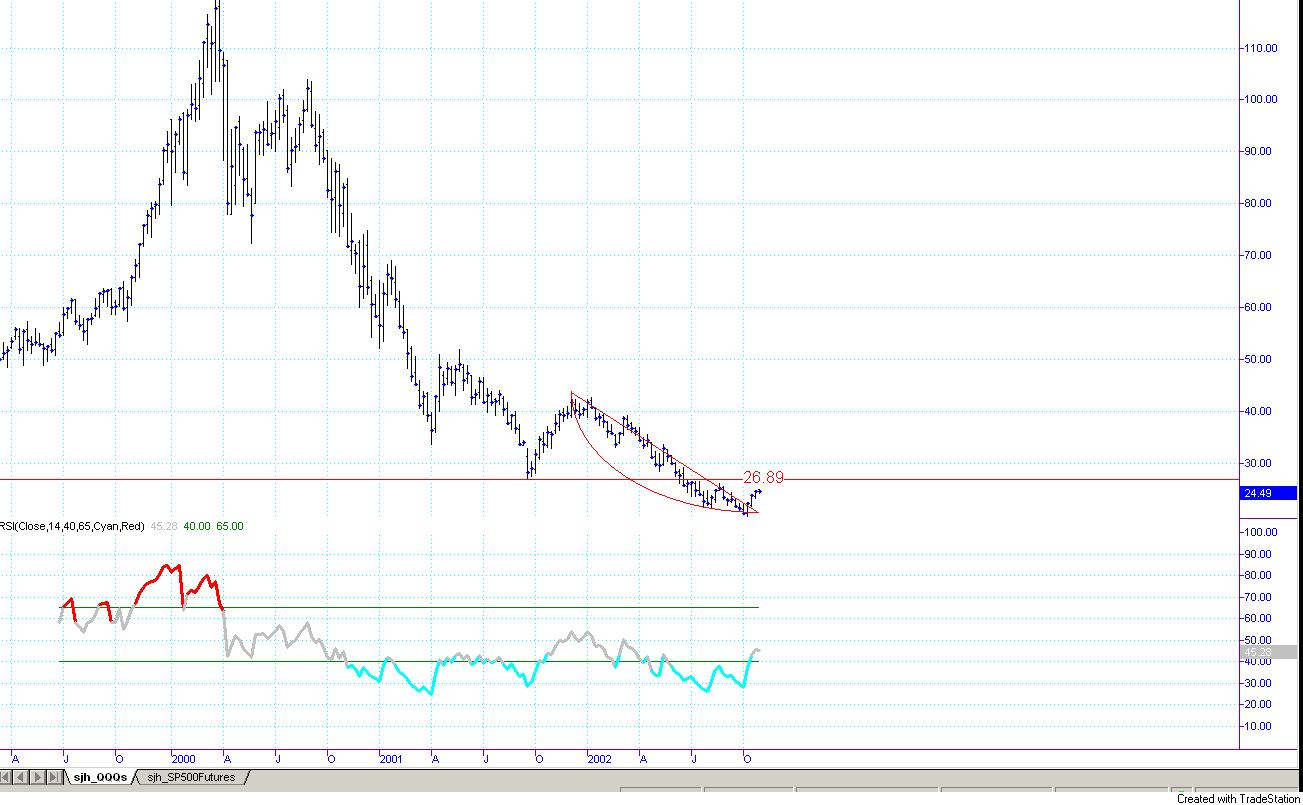
The weekly QQQ (chart above) shows that the Attractor at 26.89 is still the clear goal as the market needs to test that resistance from the underside. Whether it shoots through it or bounces off will be a big revealing technical sign.
QQQ - NASDAQ TRUST
The daily QQQ has passed through the Attractor at 24.40 successfully and appears to be holding. That's good news. Next stop is above us at 26.19 and it will probably be a painful ride up, as all the talk is about the Fed and interest rates. But, come on now, how much lower can they go? We're almost at zero as it is.
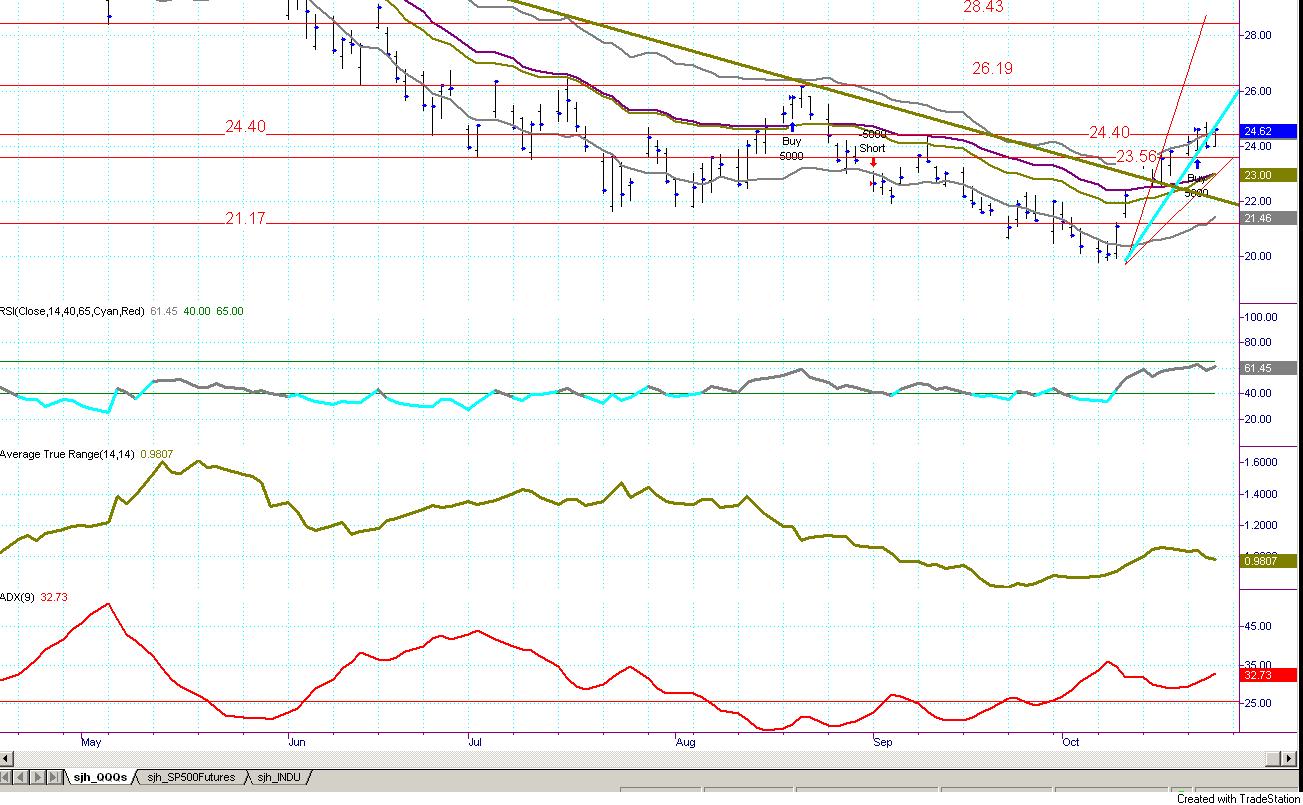 On
the chart to the left you can see that price is following the cyan trendline
that we drew last week. That's another good sign. Whether it
follows from above or below, I don't care, as long as they stay close
together. We got a buy signal on the daily model of the QQQs two days
ago, so in general we are looking for buy signals. But, the world is
full of contrarians and the intraday opportunities today were to the
downside.
On
the chart to the left you can see that price is following the cyan trendline
that we drew last week. That's another good sign. Whether it
follows from above or below, I don't care, as long as they stay close
together. We got a buy signal on the daily model of the QQQs two days
ago, so in general we are looking for buy signals. But, the world is
full of contrarians and the intraday opportunities today were to the
downside.
S&P 500 SPooS
The SPoos were not in lock-step with the QQQs today. In fact, I did most of my shorting on the SPoos today, and pulled of a long trade on the QQQs. The 15-minute SPZ chart broke below the sjh_DMA, after touching the top band of the Sunny_Bands, giving us the signal that weakness was at hand. At the time I was also watching the 5-minute SPZ chart, and as it broke through the Attractor at 900 I decided to go short. Why? More Gann numbers and the breaking of previous resistance. The market dropped fairly quickly on down to 889.45, where I started looking for excuses to take profits at any sign of upward movement. When we hit 887 I decided that was enough profit, and issued an Alert to Platinum Members.
On the short-term charts (5-min and 15-min) we are playing nearly sideways, with the bias being to the upside. We are currently positioned for a play to the upside tomorrow.
But, be nimble, be quick and ready to go where the market tells us to.
Weekend Stock Alerts
Click Here to go to the Weekend Stock Alerts Archives to view prior weeks' performance.
This week's (10/28/02) Sunny Side of the Street Weekend Stock Alerts:
How Did We Do?
Click here to view archives of past Platinum Zone commentary, including the Weekend Stock Alerts.
Weekend Stock Alerts
Click Here to go to the Weekend Stock Alerts Archives to view prior weeks' performance.
This week's (10/28/02) Sunny Side of the Street Weekend Stock Alerts:
| Symbol | BreakOut | Run To | Stop Loss | Triggered? | Goal Met? or Friday Close | Net P/L | 1000 shares | |
| 1 | COST | 36.75 | 38.5 | 35.75 | ||||
| 2 | QCOM | 37.28 | 40 | 35.36 | ||||
| 3 | ABS | 27 | 29.39 | 26.00 | ||||
| 4 | TRMS | 51.69 | 57 | 49.72 | ||||
| 5 | KFY | 9.5 | 11 | 9.00 | ||||
| 6 | EBAY | 63.27 | 69 | 61.35 | ||||
| 7 | BAC | 70.70 | 72.70 | 69.56 | ||||
| 8 | FCGI | 6.40 | 8 | 6 | ||||
| 9 | ABM | 14.50 | 16 | 14 | ||||
| 10 | AAPL | 15.52 | 17 | 14.87 | ||||
| TOTAL |
DISCLAIMERS:
Statistics, tables, charts and other information on trading
system monthly performance is hypothetical unless otherwise specified, and is
based on the referenced systems hypothetical monthly performance as it would be
executed through TradeStation Securities if per the contract/account balance and
other specifications noted in the performance tables. Actual dollar and
percentage gains/losses experienced by investors would depend on many factors
not accounted for in these hypothetical statistics, including, but not limited
to, starting account balances, market behavior, incidence of split fills and
other variations in order execution, and the duration and extent of individual
investor participation in the specified system. Fees, commissions, and other
expenses are not accounted for herein, and will affect investors net results in
actual trading. While the information and statistics given are believed to be
complete and accurate, given the hypothetical specifications, we cannot
guarantee their completeness or accuracy. THIS INFORMATION IS PROVIDED FOR
EDUCATIONAL/ INFORMATIONAL PURPOSES ONLY. These results are not indicative of,
and have no bearing on, any individual results that may be attained by the
trading system in the future. PAST OR HYPOTHETICAL PERFORMANCE IS NOT INDICATIVE
OF FUTURE RESULTS.
The CFTC requires the following disclosure statement in reference to
hypothetical results:
HYPOTHETICAL PERFORMANCE RESULTS HAVE MANY INHERENT LIMITATIONS, SOME OF WHICH
ARE DESCRIBED BELOW. NO REPRESENTATION IS BEING MADE THAT ANY ACCOUNT WILL OR IS
LIKELY TO ACHIEVE PROFITS OR LOSSES SIMILAR TO THOSE SHOWN; IN FACT, THERE ARE
FREQUENTLY SHARP DIFFERENCES BETWEEN HYPOTHETICAL PERFORMANCE RESULTS AND THE
ACTUAL RESULTS SUBSEQUENTLY ACHIEVED BY ANY PARTICULAR TRADING PROGRAM. ONE OF
THE LIMITATIONS OF HYPOTHETICAL PERFORMANCE RESULTS IS THAT THEY ARE GENERALLY
PREPARED WITH THE BENEFIT OF HINDSIGHT. IN ADDITION, HYPOTHETICAL TRADING DOES
NOT INVOLVE FINANCIAL RISK, AND NO HYPOTHETICAL TRADING RECORD CAN COMPLETELY
ACCOUNT FOR THE IMPACT OF FINANCIAL RISK OF ACTUAL TRADING. FOR EXAMPLE, THE
ABILITY TO WITHSTAND LOSSES OR TO ADHERE TO A PARTICULAR TRADING PROGRAM IN
SPITE OF TRADING LOSSES ARE MATERIAL POINTS WHICH CAN ALSO ADVERSELY AFFECT
ACTUAL TRADING RESULTS. THERE ARE NUMEROUS OTHER FACTORS RELATED TO THE MARKETS
IN GENERAL OR TO THE IMPLEMENTATION OF ANY SPECIFIC TRADING PROGRAM WHICH CANNOT
BE FULLY ACCOUNTED FOR IN THE PREPARATION OF HYPOTHETICAL PERFORMANCE RESULTS
AND ALL WHICH CAN ADVERSELY AFFECT TRADING RESULTS.
These trading systems, like any other, may involve an inappropriate level of
risk for prospective investors. THE RISK OF LOSS IN TRADING COMMODITY FUTURES
AND OPTIONS CAN BE SUBSTANTIAL AND MAY NOT BE SUITABLE FOR ALL INVESTORS. Prior
to purchasing a trading system from this or any other system vendor or investing
in a trading system with a registered commodity trading representative,
investors need to carefully consider whether such trading is suitable for them
in light of their own specific financial condition. In some cases, futures
accounts are subject to substantial charges for commission, management,
incentive or advisory fees. It may be necessary for accounts subject to these
charges to make substantial trading profits to avoid depletion or exhaustion of
their assets. In addition, one should carefully study the accompanying
prospectus, account forms, disclosure documents and/or risk disclosure
statements required by the CFTC or NFA, which are provided directly by the
system vendor and/or CTA's.
The information contained in this report is provided with the objective of
"standardizing" trading systems performance measurements, and it is intended for
educational /informational purposes only. All information is offered with the
understanding that an investor considering purchasing or leasing a system must
carry out his/her own research and due diligence in deciding whether to purchase
or lease any trading system noted within or without this report. This report
does not constitute a solicitation to purchase or invest in any trading system
which may be mentioned herein. SUNNY HARRIS & ASSOCIATES, INC, SUNNY HARRIS
and/or DOYEN CAPITAL MANAGEMENT MAKE NO ENDORSEMENT OF THIS OR ANY OTHER
TRADING SYSTEM NOR WARRANTS ITS PERFORMANCE. THIS IS NOT A SOLICITATION TO
PURCHASE OR SUBSCRIBE TO ANY TRADING SYSTEM.
x