
"The Sunny Side of the Street"
Remember: only 1000 people will ever be allowed to subscribe to the Platinum Zone. The only way to get a spot after that, will be for someone else to drop out. (That number includes free and gratis accounts to the media, etc...) Subscribe now and get the first three months at a discount...only $99.95/mo. Regularly $139.95/mo.
NAVIGATION:
- Platinum Zone (members only)
- Bronze Zone
- Free
- Only analyzes the Dow Jones daily chart
- Take me there
CHART OVERVIEW: for the real scoop, visit Yahoo Finance
|
1 Day |
5 Days |
 1 Year |
Commentary
WEDNESDAY NIGHT--OCT 30, 2002:
Another fun trading day! We were long coming into the morning from 23.80. As we approached the Attractor at 24.40 I sent an email Alert warning that I was getting ready to take profits. The QQQs went on up just a little farther than the Attractor, which is a nicely positive sign, but as expected pulled back after the extension. If you followed my signals, you picked up another pretty profit again today.
INDU - DOW JONES INDUSTRIALS
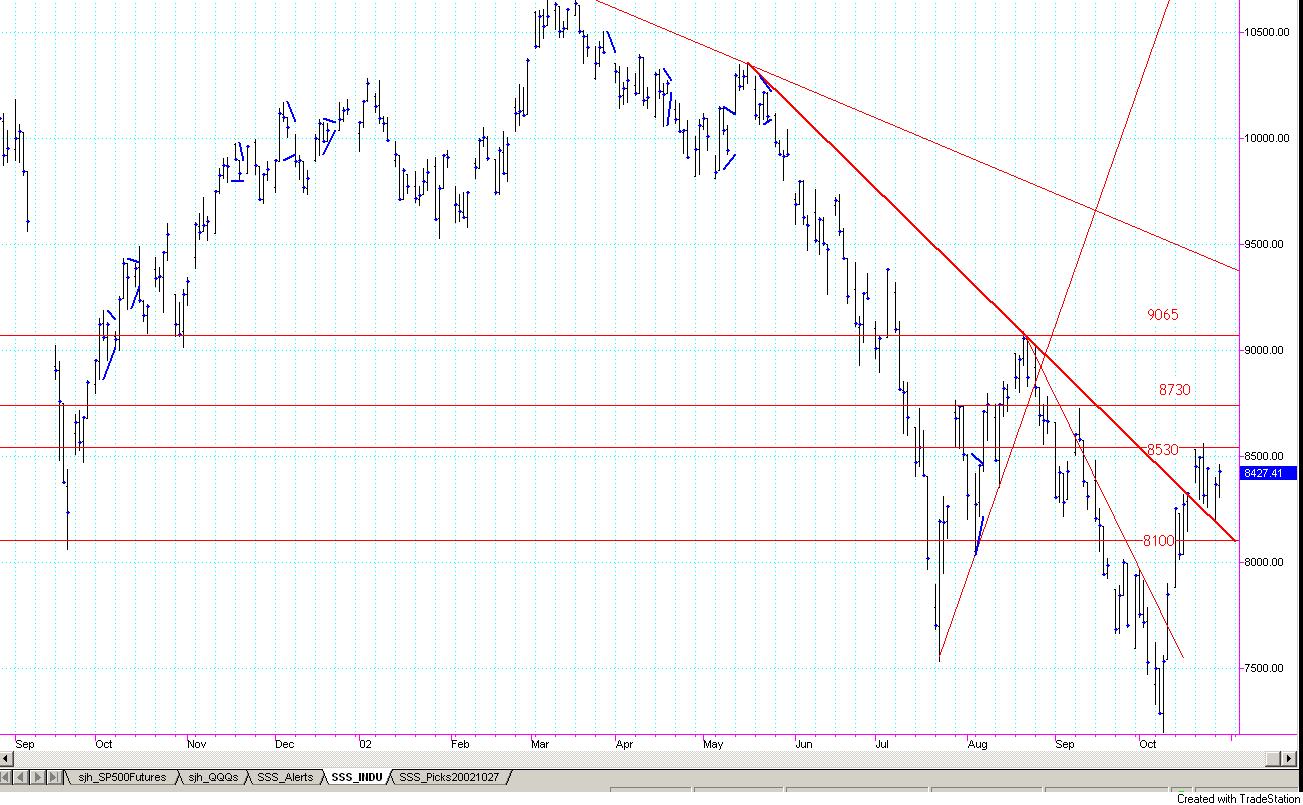 The
Dow Jones is now holding nicely above the trendline formed since the high of
May 15, 2002. We have tested the trendline several times, and we are
moving up, though cautiously. Next Attractor--8530. That should
give you another 100 points up to play with on the DIAs and should also pull
up the other indexes holding blue chips. On the DIA the Attractor is
at 84.94, with the next Attractor being all the way up at 91.04. The
Average True Range is about 2 points per day on the DIA, and the RSI is
working its way up to the bullish zone at 65. That says to me that we
still have more room to move on the upside.
The
Dow Jones is now holding nicely above the trendline formed since the high of
May 15, 2002. We have tested the trendline several times, and we are
moving up, though cautiously. Next Attractor--8530. That should
give you another 100 points up to play with on the DIAs and should also pull
up the other indexes holding blue chips. On the DIA the Attractor is
at 84.94, with the next Attractor being all the way up at 91.04. The
Average True Range is about 2 points per day on the DIA, and the RSI is
working its way up to the bullish zone at 65. That says to me that we
still have more room to move on the upside.
QQQ - NASDAQ TRUST
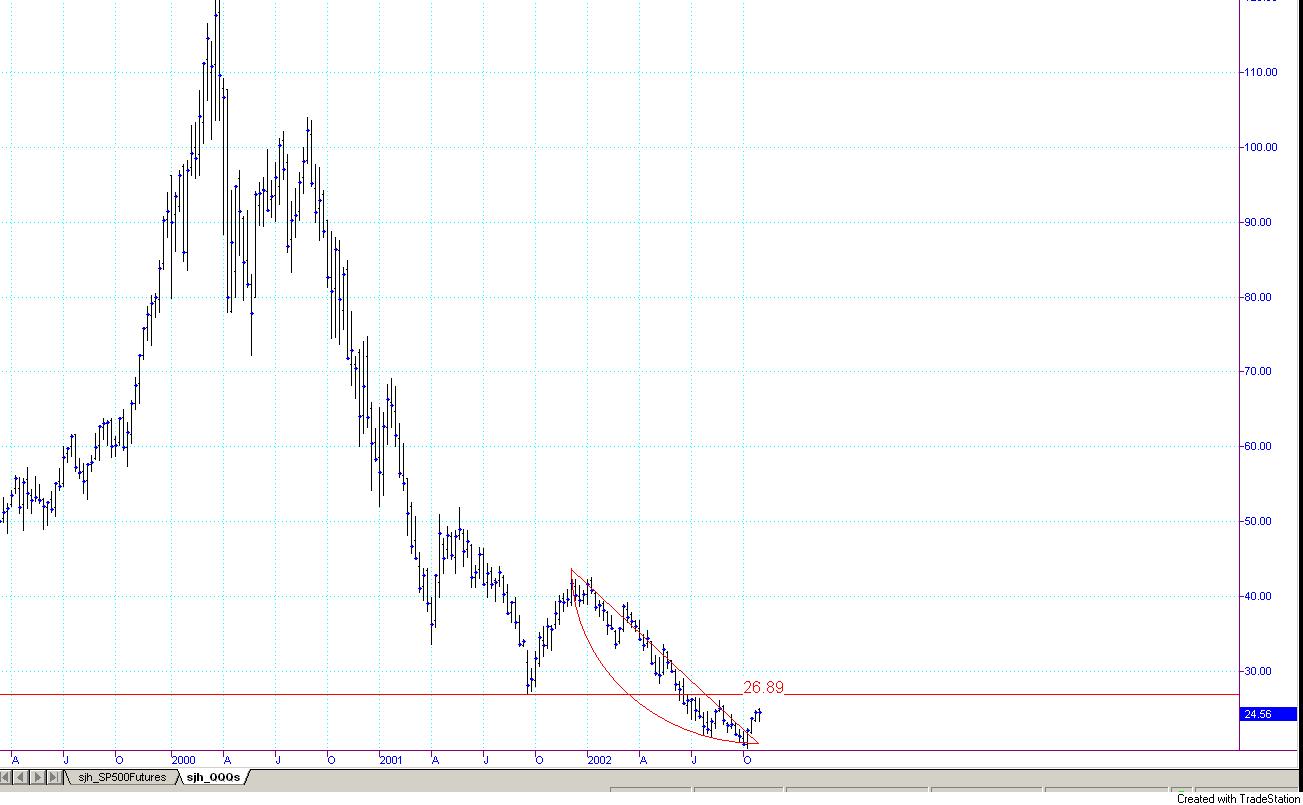 On
the weekly QQQ chart we are still rounding up toward that Attractor at
26.89, and doing so beautifully. We could stumble and grumble for
weeks or months after we get to that level, but it looks pretty promising
that we will get there. That's another 2 points to play with, and with
the current ATR at about 2 points per week, it could take a week to get
there. The daily chart looks like there is really not much resistance
between here and 26.19, but probably some resistance when we get to 26.19.
On
the weekly QQQ chart we are still rounding up toward that Attractor at
26.89, and doing so beautifully. We could stumble and grumble for
weeks or months after we get to that level, but it looks pretty promising
that we will get there. That's another 2 points to play with, and with
the current ATR at about 2 points per week, it could take a week to get
there. The daily chart looks like there is really not much resistance
between here and 26.19, but probably some resistance when we get to 26.19.
S&P 500 SPooS
The daily SPoos still look like we are about to form a 3rd wave, with the first corrective wave within the 3rd wave happening now. If that is so, we should have a pullback to 855 on the SPoos, followed by a rapid run upward to (or beyond) 952. Get ready, because if I'm reading this correctly it will be fast and hard to catch. The short-term model is currently in a buy signal, with the first resistance overhead at 903. That's a 4 point move, and no need to be greedy.
We'll be live online with intraday alerts tomorrow, so that's all for tonight. But, be nimble, be quick and ready to go where the market tells us to.
How Did We Do?
Click here to view archives of past
Platinum Zone commentary, including the Weekend Stock Alerts.
Weekend Stock Alerts
We are beginning to see some of our stock picks rise out above the BreakOut lines, so keep your eyes pealed. AGS is now at 27.42 (triggered at 27), TRMS is now at 53.35 (triggered at 51.69), AAPL is now at 15.98 (triggered at 15.52), just to name a few. We're on a run here, so take advantage of it while it lasts.
Click Here to go to the Weekend Stock Alerts Archives to view prior weeks' performance.
This week's (10/28/02) Sunny Side of the Street Weekend Stock Alerts:
| Symbol | BreakOut | Run To | Stop Loss | Triggered? | Goal Met? or Friday Close | Net P/L | 1000 shares | |
| 1 | COST | 36.75 | 38.5 | 35.75 | ||||
| 2 | QCOM | 37.28 | 40 | 35.36 | ||||
| 3 | ABS | 27 | 29.39 | 26.00 | 27.42 | |||
| 4 | TRMS | 51.69 | 57 | 49.72 | 51.69 | |||
| 5 | KFY | 9.5 | 11 | 9.00 | ||||
| 6 | EBAY | 63.27 | 69 | 61.35 | ||||
| 7 | BAC | 70.70 | 72.70 | 69.56 | ||||
| 8 | FCGI | 6.40 | 8 | 6 | ||||
| 9 | ABM | 14.50 | 16 | 14 | ||||
| 10 | AAPL | 15.52 | 17 | 14.87 | 15.52 | |||
| TOTAL |
DISCLAIMERS:
Statistics, tables, charts and other information on trading
system monthly performance is hypothetical unless otherwise specified, and is
based on the referenced systems hypothetical monthly performance as it would be
executed through TradeStation Securities if per the contract/account balance and
other specifications noted in the performance tables. Actual dollar and
percentage gains/losses experienced by investors would depend on many factors
not accounted for in these hypothetical statistics, including, but not limited
to, starting account balances, market behavior, incidence of split fills and
other variations in order execution, and the duration and extent of individual
investor participation in the specified system. Fees, commissions, and other
expenses are not accounted for herein, and will affect investors net results in
actual trading. While the information and statistics given are believed to be
complete and accurate, given the hypothetical specifications, we cannot
guarantee their completeness or accuracy. THIS INFORMATION IS PROVIDED FOR
EDUCATIONAL/ INFORMATIONAL PURPOSES ONLY. These results are not indicative of,
and have no bearing on, any individual results that may be attained by the
trading system in the future. PAST OR HYPOTHETICAL PERFORMANCE IS NOT INDICATIVE
OF FUTURE RESULTS.
The CFTC requires the following disclosure statement in reference to
hypothetical results:
HYPOTHETICAL PERFORMANCE RESULTS HAVE MANY INHERENT LIMITATIONS, SOME OF WHICH
ARE DESCRIBED BELOW. NO REPRESENTATION IS BEING MADE THAT ANY ACCOUNT WILL OR IS
LIKELY TO ACHIEVE PROFITS OR LOSSES SIMILAR TO THOSE SHOWN; IN FACT, THERE ARE
FREQUENTLY SHARP DIFFERENCES BETWEEN HYPOTHETICAL PERFORMANCE RESULTS AND THE
ACTUAL RESULTS SUBSEQUENTLY ACHIEVED BY ANY PARTICULAR TRADING PROGRAM. ONE OF
THE LIMITATIONS OF HYPOTHETICAL PERFORMANCE RESULTS IS THAT THEY ARE GENERALLY
PREPARED WITH THE BENEFIT OF HINDSIGHT. IN ADDITION, HYPOTHETICAL TRADING DOES
NOT INVOLVE FINANCIAL RISK, AND NO HYPOTHETICAL TRADING RECORD CAN COMPLETELY
ACCOUNT FOR THE IMPACT OF FINANCIAL RISK OF ACTUAL TRADING. FOR EXAMPLE, THE
ABILITY TO WITHSTAND LOSSES OR TO ADHERE TO A PARTICULAR TRADING PROGRAM IN
SPITE OF TRADING LOSSES ARE MATERIAL POINTS WHICH CAN ALSO ADVERSELY AFFECT
ACTUAL TRADING RESULTS. THERE ARE NUMEROUS OTHER FACTORS RELATED TO THE MARKETS
IN GENERAL OR TO THE IMPLEMENTATION OF ANY SPECIFIC TRADING PROGRAM WHICH CANNOT
BE FULLY ACCOUNTED FOR IN THE PREPARATION OF HYPOTHETICAL PERFORMANCE RESULTS
AND ALL WHICH CAN ADVERSELY AFFECT TRADING RESULTS.
These trading systems, like any other, may involve an inappropriate level of
risk for prospective investors. THE RISK OF LOSS IN TRADING COMMODITY FUTURES
AND OPTIONS CAN BE SUBSTANTIAL AND MAY NOT BE SUITABLE FOR ALL INVESTORS. Prior
to purchasing a trading system from this or any other system vendor or investing
in a trading system with a registered commodity trading representative,
investors need to carefully consider whether such trading is suitable for them
in light of their own specific financial condition. In some cases, futures
accounts are subject to substantial charges for commission, management,
incentive or advisory fees. It may be necessary for accounts subject to these
charges to make substantial trading profits to avoid depletion or exhaustion of
their assets. In addition, one should carefully study the accompanying
prospectus, account forms, disclosure documents and/or risk disclosure
statements required by the CFTC or NFA, which are provided directly by the
system vendor and/or CTA's.
The information contained in this report is provided with the objective of
"standardizing" trading systems performance measurements, and it is intended for
educational /informational purposes only. All information is offered with the
understanding that an investor considering purchasing or leasing a system must
carry out his/her own research and due diligence in deciding whether to purchase
or lease any trading system noted within or without this report. This report
does not constitute a solicitation to purchase or invest in any trading system
which may be mentioned herein. SUNNY HARRIS & ASSOCIATES, INC, SUNNY HARRIS
and/or DOYEN CAPITAL MANAGEMENT MAKE NO ENDORSEMENT OF THIS OR ANY OTHER
TRADING SYSTEM NOR WARRANTS ITS PERFORMANCE. THIS IS NOT A SOLICITATION TO
PURCHASE OR SUBSCRIBE TO ANY TRADING SYSTEM.