
"The Sunny Side of the Street"
![]() Remember: only 1000 people will ever be
allowed to subscribe to the Platinum Zone. The only way to get a spot
after that, will be for someone else to drop out. (That number includes
free and gratis accounts to the media, etc...)
Subscribe now and get the first
three months at a discount...only $99.95/mo. Regularly $139.95/mo.
Remember: only 1000 people will ever be
allowed to subscribe to the Platinum Zone. The only way to get a spot
after that, will be for someone else to drop out. (That number includes
free and gratis accounts to the media, etc...)
Subscribe now and get the first
three months at a discount...only $99.95/mo. Regularly $139.95/mo.
![]() Don't miss
it--Sunny only gives a few trading seminars each
year. She calls them "Solving the Puzzle"
because she
puts all the pieces together into one cohesive plan for you to become a
better trader. Make it your business! Enroll
Now--she only takes 15 students. January 17-19, 2003.
Don't miss
it--Sunny only gives a few trading seminars each
year. She calls them "Solving the Puzzle"
because she
puts all the pieces together into one cohesive plan for you to become a
better trader. Make it your business! Enroll
Now--she only takes 15 students. January 17-19, 2003.
NAVIGATION:
- Jump to the Commentary
- How to use our commentary
- FAQ
- Platinum Zone (members only)
- Bronze Zone
- Free
- Only analyzes the Dow Jones daily chart
- Take me to the Bronze Zone
CHART OVERVIEW: for the real scoop, visit Yahoo Finance
|
1 Day |
5 Days |
 1 Year |
Commentary
SUNDAY NIGHT--11/03/2002:
Monday morning should prove interesting, that is if you find volatility interesting. The after-hours and weekend trading of the QQQs has changed our position from a robust $4,000 profit to a solid $2,000 profit. Not that I'm complaining, mind you, I'm thankful for $2,000. But, that's a lot for the afterhours markets to move.
INDU - DOW JONES INDUSTRIALS
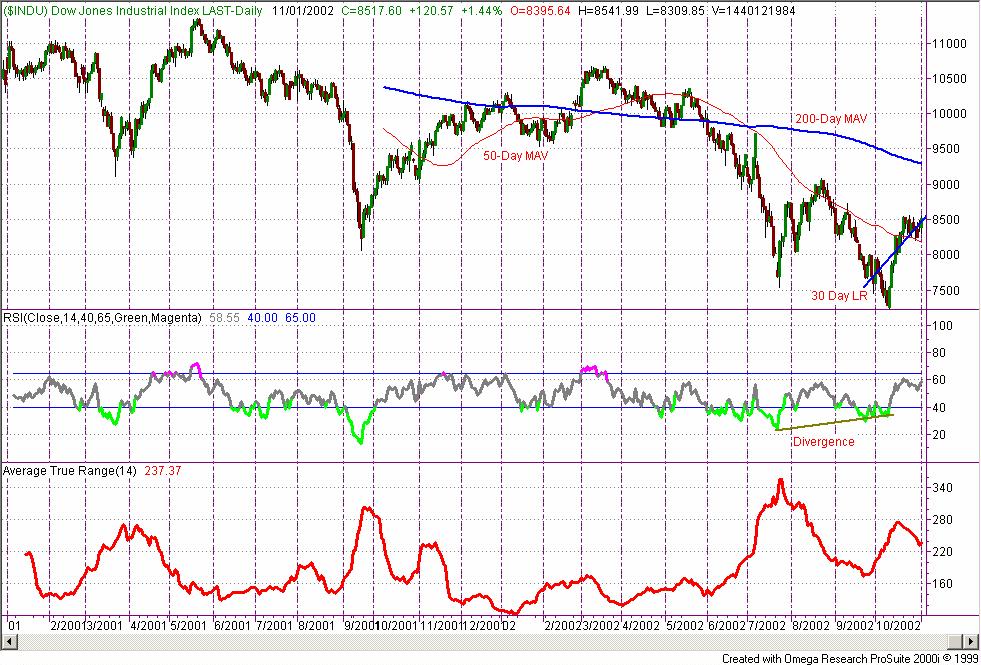 The
Dow Jones is holding nicely above its 200 day moving average, with the
30-day Linear Regression line sloping upward at about 45 degrees.
RSI is still in divergent formation with the daily chart of the Dow.
All of that is positive. The only worrisome technical sign I see is
the conjunction of the long-term downtrend line with the 30-day uptrend
Linear Regression line. That sort of conjunction usually means the
market will be indecisive for a short time before choosing which line it
wants to follow--the up one or the down one. At the moment it is
following both. (See the following chart.) In doing so, it is
composing a broadening formation, with the lows following the trendline
that goes downward and the
The
Dow Jones is holding nicely above its 200 day moving average, with the
30-day Linear Regression line sloping upward at about 45 degrees.
RSI is still in divergent formation with the daily chart of the Dow.
All of that is positive. The only worrisome technical sign I see is
the conjunction of the long-term downtrend line with the 30-day uptrend
Linear Regression line. That sort of conjunction usually means the
market will be indecisive for a short time before choosing which line it
wants to follow--the up one or the down one. At the moment it is
following both. (See the following chart.) In doing so, it is
composing a broadening formation, with the lows following the trendline
that goes downward and the
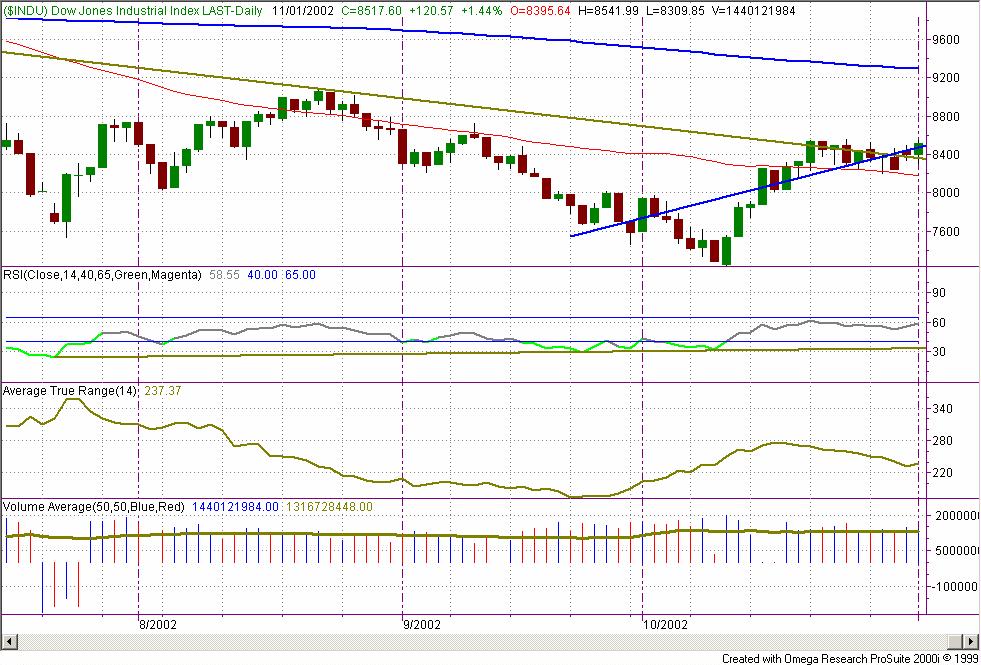 highs
following the trendline that goes upwards. To see this more clearly,
look at the next chart, which is an enlargement of the area I'm talking
about.
highs
following the trendline that goes upwards. To see this more clearly,
look at the next chart, which is an enlargement of the area I'm talking
about.
My current expectation is for the Dow to continue on upward to 9000 over the next two months. (It is currently at 8517.) But, there is a high likelihood that the Dow will go downward first, before it moves all the way on up to 9000. On this next chart of the Dow notice that I have drawn in the most significant Attractor, which is sitting right there at 9000.
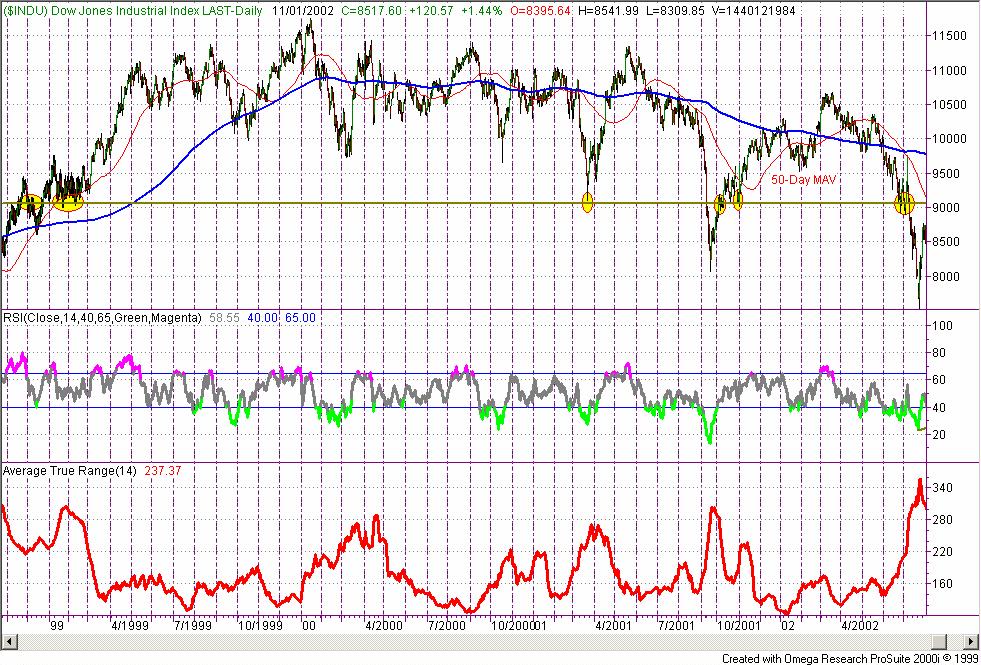 This
chart shows a clear example of how I draw the lines that I call
Attractors. I have drawn little yellow circles around the places
where price clusters form the Attractor, as price is pulled toward the
zone and then pushed away, like magnets with north and south poles.
The Attractor at 9000 should draw prices upward on the Dow, and then
momentarily release the attraction before drawing them on up again.
Whether or not we push through the Attractor at 9000 is something that
will be revealed to us through price action as it happens.
This
chart shows a clear example of how I draw the lines that I call
Attractors. I have drawn little yellow circles around the places
where price clusters form the Attractor, as price is pulled toward the
zone and then pushed away, like magnets with north and south poles.
The Attractor at 9000 should draw prices upward on the Dow, and then
momentarily release the attraction before drawing them on up again.
Whether or not we push through the Attractor at 9000 is something that
will be revealed to us through price action as it happens.
Long, long range (on the monthly Dow chart) we have just now pushed through the trendline that comes down from April 2002. We are only 2 days into the month, so the bar is still very short, but as it forms it will likely expand to the length of the current ATR. Again, whether it forms upward adding the 900 ATR points upward, or whether it forms it downward is yet to be revealed.
QQQ - NASDAQ TRUST
The weekly chart of the QQQ shows potential for movement from its current 1007 level on up to the Attractor at 1139. This is a powerful Attractor as it is not only formed from horizontal hits along a price level, but it is also hit in conjunction with a downtrend line that comes off the ultimate NASDAQ high in March 2000 with September 2000.
From the weekly chart we are long, cautiously, with a stop at 918 and a possible upswing to 1337 before once again seeing strong downward action.
The daily QQQ chart model is long since 10/18/02 and still climbing. The Attractor of import is at 26.22, and that's when I will again start worrying about which direction the market is going to go. Until that point, I think we are moving on up.
Short-term we are still long the QQQs since 10/30 at 24.02. The QQQs are currently sitting at 25.30. Tomorrow should prove an interesting trading day.
S&P 500 SPooS
Our 15-minute S&P model is long since 8:45amPT Friday. We had a quick whipsaw short trade on Thursday afternoon that I advised against taking in an email alert. So, actually we are holding long since 10/29 at 12:30pmPT. We are sitting tight up against resistance at 903, and it will take some power behind the move for it to push through tomorrow. We have been trading in a very narrow channel for 12 days. 13 is my lucky number, so I think maybe tomorrow we can push on through.
Weekend Stock Alerts
Click Here to go to the Weekend Stock Alerts Archives to view prior weeks' performance.
We had a mixed bag for the stock picks from last weekend (10/28/02). We won on some, we lost on some. But the net result was that we made an even $3,000 profit!
Sunny Side of the Street Weekend Stock Alerts
for the week beginning 11/03/02:
| Symbol | Breakout | Goal | Stop Loss | |
| ACK | 1.78 | 2.39 | 1.50 | |
| ATI | 7.49 | 9.89 | 6.69 | |
| BBBY | 36.20 | 38.00 | 35.21 | |
| BCC | 25.24 | 28 | 24.25 | |
| CBE | 33.04 | 37 | 30.29 | |
| CNXT | 2 | 3.5 | 1.25 | |
| PBY | 12.25 | 13.5 | 11.43 | |
| XRX | 7.14 | 8.00 | 6.56 | |
| GLW | 2.5 | 10 | 1.5 | LONG TERM |
DISCLAIMERS:
Statistics, tables, charts and other information on trading
system monthly performance is hypothetical unless otherwise specified, and is
based on the referenced systems hypothetical monthly performance as it would be
executed through TradeStation Securities if per the contract/account balance and
other specifications noted in the performance tables. Actual dollar and
percentage gains/losses experienced by investors would depend on many factors
not accounted for in these hypothetical statistics, including, but not limited
to, starting account balances, market behavior, incidence of split fills and
other variations in order execution, and the duration and extent of individual
investor participation in the specified system. Fees, commissions, and other
expenses are not accounted for herein, and will affect investors net results in
actual trading. While the information and statistics given are believed to be
complete and accurate, given the hypothetical specifications, we cannot
guarantee their completeness or accuracy. THIS INFORMATION IS PROVIDED FOR
EDUCATIONAL/ INFORMATIONAL PURPOSES ONLY. These results are not indicative of,
and have no bearing on, any individual results that may be attained by the
trading system in the future. PAST OR HYPOTHETICAL PERFORMANCE IS NOT INDICATIVE
OF FUTURE RESULTS.
The CFTC requires the following disclosure statement in reference to
hypothetical results:
HYPOTHETICAL PERFORMANCE RESULTS HAVE MANY INHERENT LIMITATIONS, SOME OF WHICH
ARE DESCRIBED BELOW. NO REPRESENTATION IS BEING MADE THAT ANY ACCOUNT WILL OR IS
LIKELY TO ACHIEVE PROFITS OR LOSSES SIMILAR TO THOSE SHOWN; IN FACT, THERE ARE
FREQUENTLY SHARP DIFFERENCES BETWEEN HYPOTHETICAL PERFORMANCE RESULTS AND THE
ACTUAL RESULTS SUBSEQUENTLY ACHIEVED BY ANY PARTICULAR TRADING PROGRAM. ONE OF
THE LIMITATIONS OF HYPOTHETICAL PERFORMANCE RESULTS IS THAT THEY ARE GENERALLY
PREPARED WITH THE BENEFIT OF HINDSIGHT. IN ADDITION, HYPOTHETICAL TRADING DOES
NOT INVOLVE FINANCIAL RISK, AND NO HYPOTHETICAL TRADING RECORD CAN COMPLETELY
ACCOUNT FOR THE IMPACT OF FINANCIAL RISK OF ACTUAL TRADING. FOR EXAMPLE, THE
ABILITY TO WITHSTAND LOSSES OR TO ADHERE TO A PARTICULAR TRADING PROGRAM IN
SPITE OF TRADING LOSSES ARE MATERIAL POINTS WHICH CAN ALSO ADVERSELY AFFECT
ACTUAL TRADING RESULTS. THERE ARE NUMEROUS OTHER FACTORS RELATED TO THE MARKETS
IN GENERAL OR TO THE IMPLEMENTATION OF ANY SPECIFIC TRADING PROGRAM WHICH CANNOT
BE FULLY ACCOUNTED FOR IN THE PREPARATION OF HYPOTHETICAL PERFORMANCE RESULTS
AND ALL WHICH CAN ADVERSELY AFFECT TRADING RESULTS.
These trading systems, like any other, may involve an inappropriate level of
risk for prospective investors. THE RISK OF LOSS IN TRADING COMMODITY FUTURES
AND OPTIONS CAN BE SUBSTANTIAL AND MAY NOT BE SUITABLE FOR ALL INVESTORS. Prior
to purchasing a trading system from this or any other system vendor or investing
in a trading system with a registered commodity trading representative,
investors need to carefully consider whether such trading is suitable for them
in light of their own specific financial condition. In some cases, futures
accounts are subject to substantial charges for commission, management,
incentive or advisory fees. It may be necessary for accounts subject to these
charges to make substantial trading profits to avoid depletion or exhaustion of
their assets. In addition, one should carefully study the accompanying
prospectus, account forms, disclosure documents and/or risk disclosure
statements required by the CFTC or NFA, which are provided directly by the
system vendor and/or CTA's.
The information contained in this report is provided with the objective of
"standardizing" trading systems performance measurements, and it is intended for
educational /informational purposes only. All information is offered with the
understanding that an investor considering purchasing or leasing a system must
carry out his/her own research and due diligence in deciding whether to purchase
or lease any trading system noted within or without this report. This report
does not constitute a solicitation to purchase or invest in any trading system
which may be mentioned herein. SUNNY HARRIS & ASSOCIATES, INC, SUNNY HARRIS
and/or DOYEN CAPITAL MANAGEMENT MAKE NO ENDORSEMENT OF THIS OR ANY OTHER
TRADING SYSTEM NOR WARRANTS ITS PERFORMANCE. THIS IS NOT A SOLICITATION TO
PURCHASE OR SUBSCRIBE TO ANY TRADING SYSTEM.