NAVIGATION:
| How to use our commentary |
| FAQ |
| Member sign in |
| Free week guest |
| I want to read about the benefits |

"The Sunny Side of the Street"
SUNDAY NIGHT--11/17/2002:
 |
|
In addition two of my stock picks were triggered, for a profit by the end of the week of $1,440.
INVESTORS
Two things are working in tandem now against upward movement in the market. First, there is an Attractor on the Weekly chart at 26.89, which will weigh heavy on price movement until the market breaks through it, retests it by falling back down to it, and then bounces off. If it fails, and doesn't bounce off the Attractor, then we will continue to struggle sideways or even downward. And, because this Attractor is on the Weekly chart, the sideways to downward movement could last for quite a while.
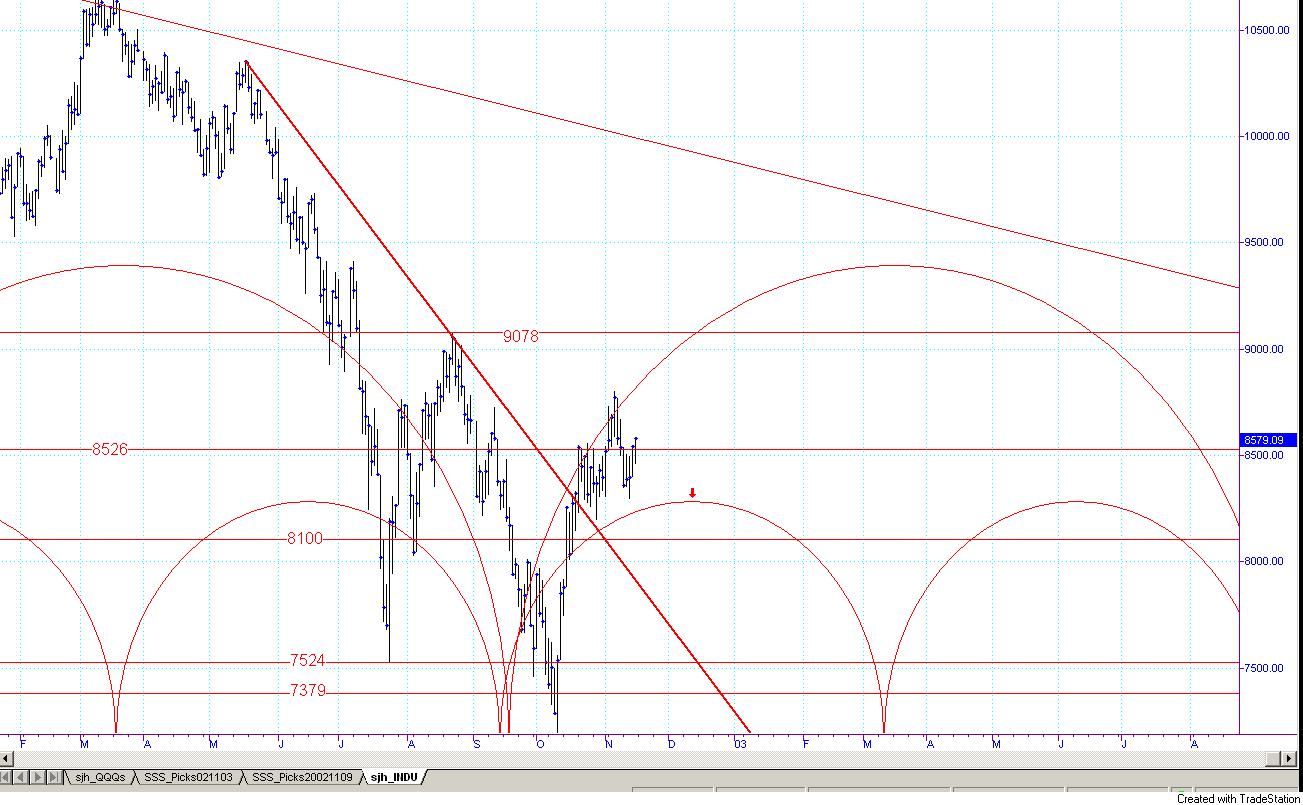 The Dow broke its major Attractor at 8526 and progressed on upward to
8800 before turning back around and re-testing the Attractor. It
broke downward and even fell as far as 8298 before making a
comeback. Thursday and Friday of the past week, the Dow once again
broke above the Attractor at 8526. From my view of the double
cycles, and the next higher Attractor, the Dow might make it as far as
9078 before year end. Beyond that I think it will have quite a
struggle to go any higher.
The Dow broke its major Attractor at 8526 and progressed on upward to
8800 before turning back around and re-testing the Attractor. It
broke downward and even fell as far as 8298 before making a
comeback. Thursday and Friday of the past week, the Dow once again
broke above the Attractor at 8526. From my view of the double
cycles, and the next higher Attractor, the Dow might make it as far as
9078 before year end. Beyond that I think it will have quite a
struggle to go any higher.
The S&P 500 front month contract has two strong Attractors at 900 and 911.50 respectively, that are slowing down any upward movement for the time being. The next higher Attractor is at 952 on the Daily chart, and ultimately that's where the S&P wants to be. But, for now, it too is struggling.
TRADERS
My 15-minute model of the QQQs is in a buy signal from midday 11/15,
holding profits over the weekend. Since we are so near to the
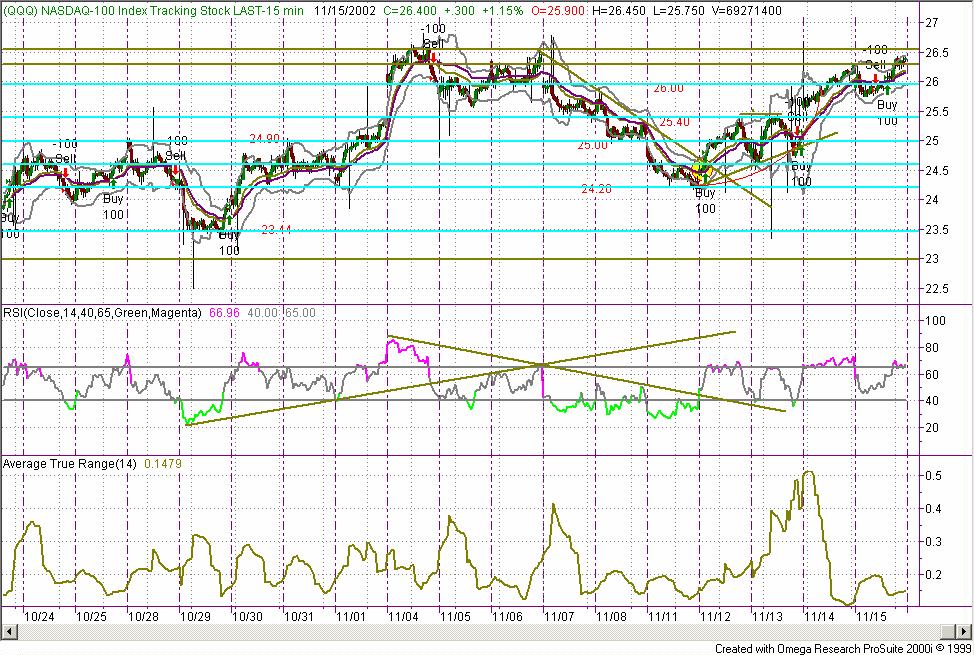 Attractor at 26.50 and 26.89, I think the QQQs will make an attempt to hit
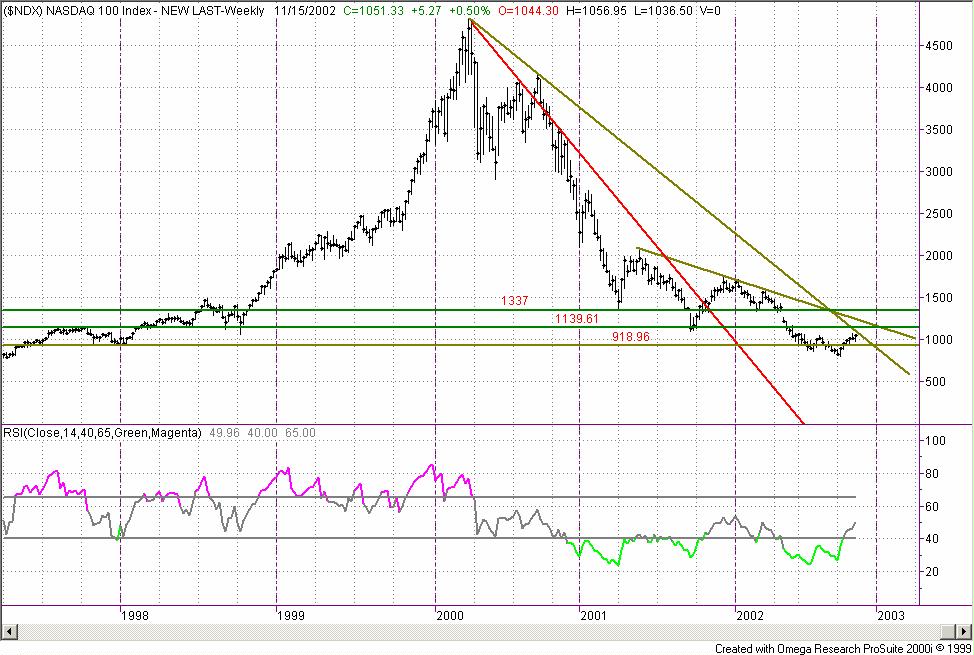
those numbers on Monday. To further thicken the stew, the $NDX
(NASDAQ 100 Index) has now run up against its downsloping trendline, which
was attracting it and will likely now repel prices for a while.
Attractor at 26.50 and 26.89, I think the QQQs will make an attempt to hit
those numbers on Monday. To further thicken the stew, the $NDX
(NASDAQ 100 Index) has now run up against its downsloping trendline, which
was attracting it and will likely now repel prices for a while.
I think the only thing that would take the markets forging on upward would be overwhelmingly positive news of some sort, to get the greed factor warmed up. It just generally seems to me that we are in for sideways to downward movement for a little while.
Weekly Stock Picks for the week beginning 11/18/2002:
| symbol | breakout | stop loss | goal | close if triggered? |
profit/ loss |
| QCOM | at market | 32.55 | 43.30 | ||
| PCAR | 46.26 | 44.69 | 48.00 | ||
| SNPS | 50.00 | 47.35 | 54.00 | ||
| ERTS | 67.00 | 68.50 | 66.30 | ||
| IBM | 81.00 | 79.00 | 83.50 | ||
| SANM | 3.45 | 3.19 | 3.75 | ||
| JDSU | 2.80 | 2.64 | 3.00 | ||
| RNWK | 3.80 | 3.61 | 4.00 | ||
| DISH | 19.45 | 19.00 | 20.28 | ||
| WEN | 28.18 | 27.67 | 28.74 | ||
| TOTAL | |||||
![]() AND... if you are a TradeStation user, you need to
attend "TradeStation Made Easy"
February 7-9, 2003. Sunny knows TradeStation and EasyLanguage
as only another Trader could, and the class is more engaging and jam
packed with useful information than any other class you can find, at any
price. Enroll
Now--she only takes 15 students.
AND... if you are a TradeStation user, you need to
attend "TradeStation Made Easy"
February 7-9, 2003. Sunny knows TradeStation and EasyLanguage
as only another Trader could, and the class is more engaging and jam
packed with useful information than any other class you can find, at any
price. Enroll
Now--she only takes 15 students.
