NAVIGATION:
| How to use our commentary |
| FAQ |
| Member sign in |
| Free week guest |
| I want to read about the benefits |

"The Sunny Side of the Street"
TUESDAY NIGHT--11/26/2002:
 Figure 1 |
|
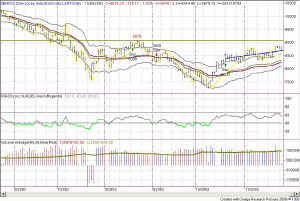
In yesterday's commentary I said I would stay long the daily chart unless we hit 27.40 on a stop. We did that today. So, that puts my model on the sidelines unless we now breakout above the former stop by 10 cents, meaning 27.50. If the market shows itself to be moving up, I am certainly not against re-entering.
Interestingly, there is an Attractor at 26.36 on the Daily chart, and the DMA closed today at 25.9--so, they are pretty close. I think the likely scenario would be for daily prices to back off to the 26.36 level tomorrow, and then bounce off the Attractor to continue the march upward for another day or two.
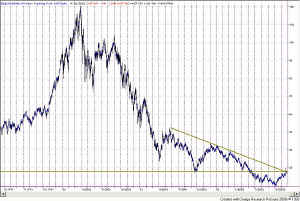
If you look at a long-term daily chart of the QQQs (or the Dow, or the S&P) you can see the general rounding that is beginning to form as we (hopefully) put in bottoming action. However, looking at Figure 2, above, you will see that we are just now pushing up against resistance coming from the September 2001 lows, and we are also pushing up against a downsloping trendline that I have drawn on the tops from 5/2001 to 12/2001. That forms a pretty serious juncture to try and push through, technically. It's no wonder today was a down day.
INVESTORS
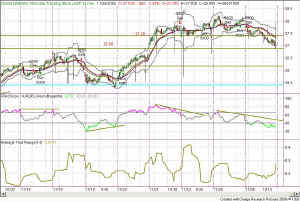
The RSI came back under the critical 65 level today, forming an indicator double-top. It is too early to tell whether RSI can stay a little longer up in the bullish range, but if it does manage to do so I would be encouraged.
For most of 2002 RSI spent its time in the bearish range, dipping back and forth through the 40 line and never getting up as high as 60. Now we have finally made it over the critical 60 number, and we could just as easily spend some time dipping back and forth over 60.
But, I don't think we will. I think, from looking at the chart in Figure 3, and remembering the double cycles coming to a peak, that we might be in for some downside activity over the few weeks as the year draws to a close. On the QQQs the 24 price level looks like about a 38% retracement from the recent "high" and could easily be the next target. I still think the market will make another run upward to try to get through the resistance overhead, but I think it will fail.
TRADERS
My model gave a short signal this morning, but in an emailed Alert I said I wouldn't take it unless the market showed some serious downward movement. It did just that when it broke under 27.39 and that's when I decided to short. It wasn't good for a great profit, but it was still a profit, and I'm not complaining.
Today's action intraday has me rethinking my premise that we can steadily continue the march upward. Today makes me think we can still climb, but that it will be difficult going all the way along. We have a head-and-shoulders formation of sorts, but it is very complex and nearly resolved. To gather up some steam and pop back upward it only needs to touch the tops from 11/18 and it could continue the climb.
But, ultimately, even if we have intraday gyrations upward, if the daily chart is going down, so will the intraday. The downsloping trendline over the tops will be very telling--whether price follows the line on down, or whether it bounces and continues to add to the bottom formation.
We shall see as time progresses--the market will tell us what it is doing by revealing more technical signs.
Many happy returns! And, stay nimble.
Weekly Stock Picks for the week beginning 11/24/2002:
| symbol | breakout | stop loss | goal | close if triggered? |
profit/ loss |
| WEN | 28.00 | 27.5 | 29.0 | ||
| KO | 46.50 | 44.25 | 50 | ||
| ACK | 1.90 | 1.28 | 2.67 | ||
| MCD | 19.33 | 18 | 22 | ||
| G | 31.50 | 30.50 | 33 | ||
| T | 28.11 | 27.74 | 28.6 | ||
| YHOO | 18.40 | 16.80 | 20.53 | ||
| COST | 33.07 | 31.57 | 34.57 | ||
| CIEN | 5.7 | 5.31 | 10 | ||
| JDSU | 3.3 | 3.02 | 5 | ||
| TOTAL | |||||
![]() AND... if you are a TradeStation user, you need to
attend "TradeStation Made Easy"
February 7-9, 2003. Sunny knows TradeStation and EasyLanguage
as only another Trader could, and the class is more engaging and jam
packed with useful information than any other class you can find, at any
price. Enroll
Now--she only takes 15 students.
AND... if you are a TradeStation user, you need to
attend "TradeStation Made Easy"
February 7-9, 2003. Sunny knows TradeStation and EasyLanguage
as only another Trader could, and the class is more engaging and jam
packed with useful information than any other class you can find, at any
price. Enroll
Now--she only takes 15 students.


