NAVIGATION:
| How to use our commentary |
| FAQ |
| Member sign in |
| Free week guest |
| I want to read about the benefits |
| View Daily Archives |
| View Weekly Archives |

"The Sunny Side of the Street"
MONDAY NIGHT--12/09/2002:
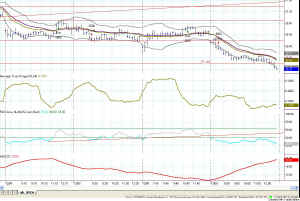
On the chart in Figure 2 you can see that ADX is moving nicely upward, showing that we have a trend in force. ADX doesn't tell us which direction the trend is moving, just that we have a trend. Moving averages and trendlines tell us the direction of the trend.
Also, on Figure 2, you can see that just prior to the sell signal price on the QQQs dipped below the middle Sunny_Bands and below the Attractor we had set at 26.20. That in itself was enough to enter a short trade. By watching closely as price moved throughout the day I was on the alert to take profits anytime price touched the Sunny_Bands midline and to re-enter the short position if price again dipped below the midline.
At noon I issued an alert that price was continually touching the midline and to beware that it might mean the market was trying to head back up over the midline. At the same time I said that if price fell again below the lower band I would be thinking about shorting again.
At 12:30pmPT price dipped below the lower band, and then the 12:45 bar dipped decisively beneath the band. True to my word, I again went short.
So, now I am sitting in an overnight short trade on the QQQs hoping it will gap hugely lower, like it did last week, and everybody can make lots of money.
RSI is deeply oversold, and it can stay that way for long periods of time, but this is a reason to be on your toes if this trade begins to falter. By that I mean, if the price of QQQ goes up to the Sunny_Bands midline, I'm getting out of the short trade, with any profits I may or may not have at the time.
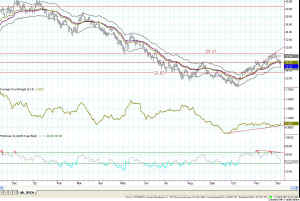
For a little longer range view of the situation, let's look at the technicals on the daily chart of the QQQ (Figure 3).
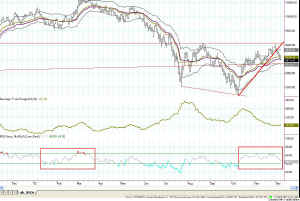
I have drawn an upsloping trendline on the lows of the Average True Range. That interests me, because as the ATR expands (Range Expansion) we are often likely to see a volatility breakout. You can also see on the same chart that there was a divergence between price and the RSI indicator, where I have drawn the trendlines. That divergence often leads to prices moving in the direction of the indicator, and against the direction of previous price movement. That was the forewarning we had, so that as soon as it was confirmed by price touching the midline Sunny_Band I would either have shorted or have exited any long positions to stand aside.
The drop that happened today took the QQQs below the midline, but not quite to the bottom band. To me that shows cause for the market to continue on lower tomorrow, at least until it hits the lower Sunny_Band. As I said this morning, there is another lower attractor at 24.75, which isn't very far away at this point. Surely we can make that tomorrow. And then, on the daily chart, there is an Attractor at 23.60.
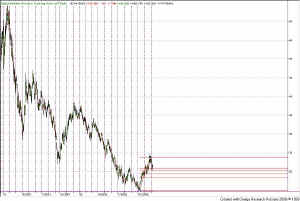
In Figure 4 I have shown a daily chart of the QQQs with Fibonacci retracements drawn from the low of 10/8/2002 to the "high" of 12/2. As you can see, the market has already hit the first line of retracement (the .382 retracement). If we go on down tomorrow, the 50% retracement is at 24.01. After that the 2/3 (more precisely 0.618) retracement is lying in wait at 23.11.
In summary, it looks like we have a little more retracing to do before beginning the next leg up.
Be quick, be nimble, and always keep your respect for the markets--it's a risky business.
![]() Don't miss
it--Sunny only gives a few trading seminars each
year. She calls them "Solving the Puzzle"
because she
puts all the pieces together into one cohesive plan for you to become a
better trader. Make it your business! Enroll
Now--she only takes 15 students. January 17-19, 2003.
AND..to match Larry Williams' offer, on Friday we will be trading real-time,
with real money. I will split the winnings with the
class, and if there are losses I'll keep them for myself. Just
think...the seminar could be free!
Don't miss
it--Sunny only gives a few trading seminars each
year. She calls them "Solving the Puzzle"
because she
puts all the pieces together into one cohesive plan for you to become a
better trader. Make it your business! Enroll
Now--she only takes 15 students. January 17-19, 2003.
AND..to match Larry Williams' offer, on Friday we will be trading real-time,
with real money. I will split the winnings with the
class, and if there are losses I'll keep them for myself. Just
think...the seminar could be free!
Weekly Stock Picks for the week beginning 12/08/2002:
(Last week's picks made a profit of $0. Click Here to view the picks for last week, in the Archives.)
| Symbol | Breakout | Stop Loss | Goal | Close if Triggered | Profit/Loss |
| AEP | 30 | 26 | 35 | ||
| APC | 50 | 44.5 | 57 | ||
| BK | 30 | 27.1 | 35.26 | ||
| GM | 40 | 47 | 37 | ||
| NKE | 48 | 45 | 52 | ||
| MDT | 47.29 | 43.62 | 51.65 | ||
| TOTAL |
![]() AND... if you are a TradeStation user, you need to
attend "TradeStation Made Easy"
February 7-9, 2003. Sunny knows TradeStation and EasyLanguage
as only another Trader could, and the class is more engaging and jam
packed with useful information than any other class you can find, at any
price. Enroll
Now--she only takes 15 students. And, the same real-time
trading offer applies.
AND... if you are a TradeStation user, you need to
attend "TradeStation Made Easy"
February 7-9, 2003. Sunny knows TradeStation and EasyLanguage
as only another Trader could, and the class is more engaging and jam
packed with useful information than any other class you can find, at any
price. Enroll
Now--she only takes 15 students. And, the same real-time
trading offer applies.


