NAVIGATION:
| How to use our commentary |
| FAQ |
| Member sign in |
| Free week guest |
| I want to read about the benefits |
| View Daily Archives |
| View Weekly Archives |

"The Sunny Side of the Street"
WEDNESDAY NIGHT--12/11/2002:
Now, the thing that is still concerning me is that the RSI is still sitting in bearish territory, even with these supposed up moves. I say "supposed" because really all the market is doing (from a long-term perspective) is going sideways. The full daily bar on the QQQ chart is still below the Sunny_Bands midline, and going nowhere fast. It still looks to me like it should go on down to the bottom line.
This brings me to a question several subscribers have asked. Where can you get your own copy of the Sunny_Bands indicator? The answer, of course, is to buy it from me. The indicator is written for TradeStation and costs $795. If you already have my Dynamic Moving Average indicator, the price for Sunny_Bands is just $495. Such a deal. I don't have the indicator ready yet for MetaStock users. I think the Sunny_Bands do a better job of isolating profit taking and stop loss places better than Bollinger Bands. In fact, that's why I wrote them. I was looking for something to more precisely set entries and exits than Bollinger Bands, and I'm quite happy with the results. And, just as an added incentive, if you are a subscriber to the Sunny Side of the Street, you can take an extra 15% off the price.
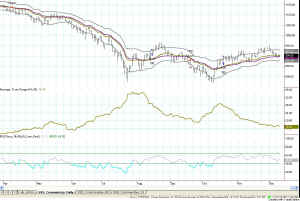
If you'll enlarge Figure 1 and take a look at the SPX index, you can see that my Dynamic Average halted any downward pressure over the last 4 days, which is a positive sign for the S&P. My model is still on a long-term buy signal on the S&Ps with a slight profit of $8,750 since 10/21/2002. It has been a slow climb up the wall of worry. And, not without reason, mind you. A potential war in the mid-East that would likely extend to our homeland is no small worry.
The RSI on the daily QQQ chart is still in bearish territory, unless it turns up sharply in the next few days and at least touches 65. That would make the reading bullish, because it would not have gotten down all the way to 40 before climbing back up. But, I'm not putting odds on that happening.
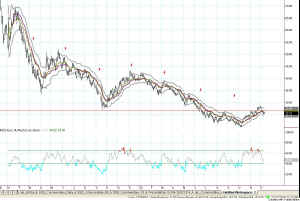
In the next Figure I have market with red arrows all of the previous expiration/rollovers. (Figure 2)
I don't see a single instance where the rollover was followed by a bullish move up. So, here we are again at rollover time--should we expect a bearish or a bullish move following? I'd still say we are going on down to the bottom Sunny_Bands line.
BRING A FRIEND AND GET 1 MONTH FOR FREE. For each person you refer to The Sunny Side of the Street (and who subscribes) I will give you a free month on your personal subscription. This is a word of mouth business, and I need your help to spread the word. If you tell a friend, just email me his name/email address, and if he/she subscribes you will get the credit, and a warm welcome thanks from me.
In my seminars I ask the questions "Where's the money?" and "How do I get some?" By watching the QQQs day after day I feel like I'm watching pain dry. We continually just chop around. I think now it's time to look for another trading instrument. Tomorrow I'll sort through some stocks and some other ETFs and some Mutual Funds, and maybe even some commodities to see whether there is more money to be made elsewhere.
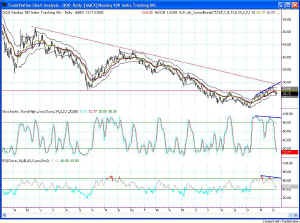
But, back to the QQQ chart for a moment--I digress. Years ago I learned a strategy where you trade the divergences if you find matching divergence in RSI and Stochastics against price. At this juncture we have just that, even though it is slight, in the QQQs chart. Take a look at Figure 3.
You can see at the right edge of the chart that I have drawn the trendlines on the most recent highs of RSI and Stochastics. They both slope slightly downward. Likewise, I have drawn the trendline on the recent highs of price, and it slopes upward. According to this ancient strategy I learned that this is indicative of an impending reversal in price. If so, that would take the QQQs on down to the bottom Sunny_Band.
Notice also, that as the days progress, price is getting closer to the lower Attractors in the table at the top of this commentary, not closer to the upper Attractors.
I'LL MAKE YOU ANOTHER OFFER. Send a friend my way for one of the upcoming seminars, and I'll give you $250 cash. Take your loved on to a nice dinner out on me.
Well, that's the way I read the evidence. And, I'm still going to sit on the sidelines until we have some sort of breakout. This choppy stuff isn't worth playing with. On the QQQs I would want to see a breakout below 25.40 to go short, or above 26.20 to go long. On the Dow we would have to break above 8621 or below 8516. On the SPX we would need to break above 912.80 or below 897.65. If any of those things happens, I might believe we are about to make a considered move. Until that time, we're just channel trading, and in a narrow channel at that.
I think what is most likely next is still for the markets to correct down to the lower bands, and then take another surprise bounce upward.
Be quick, be nimble, and always keep your respect for the markets--it's
a risky business. And remember, we don't have to trade just because
the market is open. Sometimes there are no trades worth
taking. It's better to sit on the sidelines that to be giving money
to the market!
![]() Don't miss
it--Sunny only gives a few trading seminars each
year. She calls them "Solving the Puzzle"
because she
puts all the pieces together into one cohesive plan for you to become a
better trader. Make it your business! Enroll
Now--she only takes 15 students. January 17-19, 2003.
AND..to match Larry Williams' offer, on Friday we will be trading real-time,
with real money. I will split the winnings with the
class, and if there are losses I'll keep them for myself. Just
think...the seminar could be free!
Don't miss
it--Sunny only gives a few trading seminars each
year. She calls them "Solving the Puzzle"
because she
puts all the pieces together into one cohesive plan for you to become a
better trader. Make it your business! Enroll
Now--she only takes 15 students. January 17-19, 2003.
AND..to match Larry Williams' offer, on Friday we will be trading real-time,
with real money. I will split the winnings with the
class, and if there are losses I'll keep them for myself. Just
think...the seminar could be free!
Weekly Stock Picks for the week beginning 12/08/2002:
(Last week's picks made a profit of $0. Click Here to view the picks for last week, in the Archives.)
| Symbol | Breakout | Stop Loss | Goal | Close if Triggered | Profit/Loss |
| AEP | 30 | 26 | 35 | ||
| APC | 50 | 44.5 | 57 | ||
| BK | 30 | 27.1 | 35.26 | ||
| GM | 40 | 47 | 37 | ||
| NKE | 48 | 45 | 52 | ||
| MDT | 47.29 | 43.62 | 51.65 | ||
| TOTAL |
![]() AND... if you are a TradeStation user, you need to
attend "TradeStation Made Easy"
February 7-9, 2003. Sunny knows TradeStation and EasyLanguage
as only another Trader could, and the class is more engaging and jam
packed with useful information than any other class you can find, at any
price. Enroll
Now--she only takes 15 students. And, the same real-time
trading offer applies.
AND... if you are a TradeStation user, you need to
attend "TradeStation Made Easy"
February 7-9, 2003. Sunny knows TradeStation and EasyLanguage
as only another Trader could, and the class is more engaging and jam
packed with useful information than any other class you can find, at any
price. Enroll
Now--she only takes 15 students. And, the same real-time
trading offer applies.


