NAVIGATION:
| How to use our commentary |
| FAQ |
| Member sign in |
| Free week guest |
| I want to read about the benefits |
| View Daily Archives |
| View Weekly Archives |

"The Sunny Side of the Street"
THURSDAY NIGHT--12/19/2002:
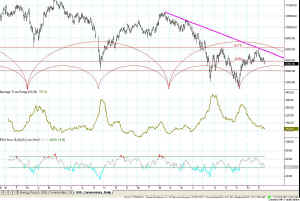
That said, I am going to be putting more weight into my short trades than into the long signals over the next month or two. When the market gets into a bearish mode, as seen by the current RSI configuration and by the trendlines drawn over the tops in Figure 2, the long signals often don't turn out to be very profitable, but rather are just whipsaw adjustments in what turns out to be a continuing pattern down.
Intraday today was unproductively choppy with a gap opening up which had no follow-through. In fact, it just gapped back down and spent the remainder of the day going sideways.
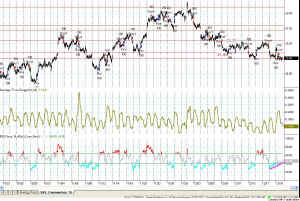
In Figure 3 take a look at the pennant formation drawn by my Pennant Finder indicator. The lower line on the pennant is pretty close to 25.00, which is where we are experiencing support and resistance (the Attractor). Notice the magenta line I have drawn beneath the lows on the RSI indicator. That line is in divergence with price, at the top of the chart. This sort of divergence generally resolves with the market getting back in synch with the RSI indicator, by going up. So, even though my longer term view is currently bearish, on the short term chart I think we can move back up to 26.20 before tumbling down again, to get in synch with the longer term chart.
This sort of conflict in indicators is one of the reasons it is so important to follow a prescribed strategy--hopefully one that has been tested and proven to have a CPC Index greater than 1.2. When those about you are losing their heads, you will be able to hang onto yours and be firm by following your strategy.
We are not hoping to win the lottery here. There is more of a chance of getting hit by lightning twice than in winning the lottery. We are not hoping to hit home runs either. My goal is simply to steadily add more in the profit pile than in the loss pile. Over time, that's what success is made of.
As always, be cautious, be nimble, and good luck!
I'LL MAKE YOU ANOTHER OFFER. Send a friend my way for one of the upcoming seminars, and I'll give you $250 cash. Take your loved on to a nice dinner out on me.
![]() Don't miss
it--Sunny only gives a few trading seminars each
year. She calls them "Solving the Puzzle"
because she
puts all the pieces together into one cohesive plan for you to become a
better trader. Make it your business! View
the syllabus--she only takes 15 students. January 17-19, 2003.
AND..to match Larry Williams' offer, on Friday we will be trading real-time,
with real money. I will split the winnings with the
class, and if there are losses I'll keep them for myself. Just
think...the seminar could be free!
Don't miss
it--Sunny only gives a few trading seminars each
year. She calls them "Solving the Puzzle"
because she
puts all the pieces together into one cohesive plan for you to become a
better trader. Make it your business! View
the syllabus--she only takes 15 students. January 17-19, 2003.
AND..to match Larry Williams' offer, on Friday we will be trading real-time,
with real money. I will split the winnings with the
class, and if there are losses I'll keep them for myself. Just
think...the seminar could be free!
Weekly Stock Picks for the week beginning 12/15/2002:
(Last week's picks made a profit of $0. Click Here to view the picks for last week, in the Archives.)
12/17/2002 -- We are getting really close to some of the breakout lines, so keep watching. NSOL did break the line today, so the model is now long NSOL.
| Symbol | Breakout | Stop Loss | Goal | Close if Triggered | Profit/Loss |
| NSOL | 0.78 | 0.62 | 1 | yes | |
| AMCC | 4.11 | 3.63 | 5.28 | ||
| ADCT | 2.24 | 1.64 | 2.81 | ||
| ADBE | 27.18 | 24.73 | 32 | ||
| WIN | 15.3 | 14.02 | 18 | ||
| WPI | 30.12 | 28.15 | 33.5 | ||
| STI | 60.25 | 56.63 | 68 | ||
| SLE | 22.77 | 21.56 | 24 | ||
| RBK | 28.38 | 27.04 | 30 | ||
| FO | 50 | 47.36 | 54 | ||
| TOTAL |
![]() AND... if you are a TradeStation user, you need to
attend "TradeStation Made Easy"
February 7-9, 2003. Sunny knows TradeStation and EasyLanguage
as only another Trader could, and the class is more engaging and jam
packed with useful information than any other class you can find, at any
price. Enroll
Now--she only takes 15 students. And, the same real-time
trading offer applies.
AND... if you are a TradeStation user, you need to
attend "TradeStation Made Easy"
February 7-9, 2003. Sunny knows TradeStation and EasyLanguage
as only another Trader could, and the class is more engaging and jam
packed with useful information than any other class you can find, at any
price. Enroll
Now--she only takes 15 students. And, the same real-time
trading offer applies.


