NAVIGATION:
| How to use our commentary |
| FAQ |
| Member sign in |
| Free week guest |
| I want to read about the benefits |
| View Daily Archives |
| View Weekly Archives |

"The Sunny Side of the Street"
MONDAY NIGHT--January 6, 2003
The QQQs paused there for about 2 hours, and went on up, making it as hig as 26.59 before breaking back down to close at 26.39. So, okay, I missed 20 cents.
TRADERS:
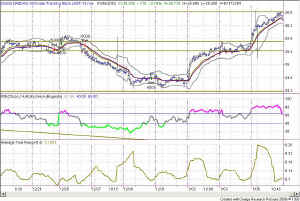
RSI held high all day today near the 80 range, until the end of the day on the 15-minute chart. In fact, RSI has held nicely in the bullish zone for the past 3 trading sessions on the intraday chart.
Looking to the daily charts for more information, today's session put the INDU cleanly above the 50-day moving average. That's good news. The next step is to reach for the 200-day moving average and test that area for just a bit. The Attractor at 8645 was penetrated by today's action, so I'm looking for the next stop to be 9061 on the Dow. RSI on the daily chart needs to get out above the 60 level before I'm going to start looking for any correction. Average True Range has been quite low during the holiday sessions, and it's now time for ATR to start making some headway as well. Today's 171 point move brought the ATR upward to 142, but I would like to see it get back above 160. When it gets back up in that range I will start watching again for corrections.
INVESTORS:
The Attractor at 8945 is pulling the Dow upwards now for a retest of that area. That should happen in the next few days, and then we will see whether we can create a mad dash 3-wave on up and above the 200-day moving average. That's the stumbling area, if we are to have one. The Dow and the QQQ look solid enough to begin climbing the proverbial wall of worry toward the upside. The SPX, however, seemed like the weak player today. Of note is the hammer formed in the candlestick view of today's SPX. This pattern is often a reversal pattern, so maybe tomorrow will belong to the S&P.
So, as always, stay nimble, humble and take small losses and big wins.
![]() Don't miss
it--Sunny only gives a few trading seminars each
year. She calls them "Solving the Puzzle"
because she
puts all the pieces together into one cohesive plan for you to become a
better trader. Make it your business! View
the syllabus--she only takes 15 students. January 17-19, 2003.
AND..to match Larry Williams' offer, on Friday we will be trading real-time,
with real money. I will split the winnings with the
class, and if there are losses I'll keep them for myself. Just
think...the seminar could be free!
Don't miss
it--Sunny only gives a few trading seminars each
year. She calls them "Solving the Puzzle"
because she
puts all the pieces together into one cohesive plan for you to become a
better trader. Make it your business! View
the syllabus--she only takes 15 students. January 17-19, 2003.
AND..to match Larry Williams' offer, on Friday we will be trading real-time,
with real money. I will split the winnings with the
class, and if there are losses I'll keep them for myself. Just
think...the seminar could be free!
Weekly Stock Picks for the week beginning 1/5/2003:
| Symbol | Breakout | Stop Loss | Goal | Close if Triggered | Profit/Loss |
| UNM | mkt | 17.49 | 19.11 | ||
| WPI | 29.5 | 27.44 | 33 | ||
| AHLS | 0.83 | 0.50 | 1.4 | ||
| ASDS | 0.46 | 0.37 | 0.6 | ||
| CNXT | 1.85 | 1.5 | 2.5 | ||
| JDSU | 2.95 | 2.38 | 3.5 | ||
| LGTO | 5.52 | 4.33 | 7.63 | ||
| MCHP | 26 | 24 | 30 | ||
| PCAR | 48.3 | 46.3 | 51.6 | ||
| RNWK | 4.06 | 3.5 | 5 | ||
| TOTAL |
![]() AND... if you are a TradeStation user, you need to
attend "TradeStation Made Easy"
February 7-9, 2003. Sunny knows TradeStation and EasyLanguage
as only another Trader could, and the class is more engaging and jam
packed with useful information than any other class you can find, at any
price. Enroll
Now--she only takes 15 students. And, the same real-time
trading offer applies.
AND... if you are a TradeStation user, you need to
attend "TradeStation Made Easy"
February 7-9, 2003. Sunny knows TradeStation and EasyLanguage
as only another Trader could, and the class is more engaging and jam
packed with useful information than any other class you can find, at any
price. Enroll
Now--she only takes 15 students. And, the same real-time
trading offer applies.

