NAVIGATION:
| How to use our commentary |
| FAQ |
| Member sign in |
| Free week guest |
| I want to read about the benefits |
| View Daily Archives |
| View Weekly Archives |

"The Sunny Side of the Street"
SUNDAY NIGHT--January 12, 2003
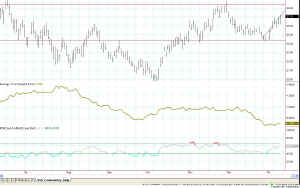
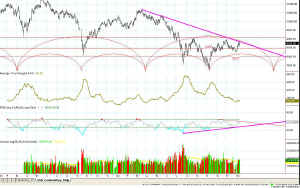 Figure 1 - Daily chart of INDU (Dow Jones) My model Stock Picks portfolio just surpassed $50,450 in gains since inception on August 19, 2002. Take a look at the archives. As I look back at the market's action each day, in order to pen this column, I see (with 20-20 hindsight) that it couldn't be much more predictable. Right now the Dow is bumping up against... |
|
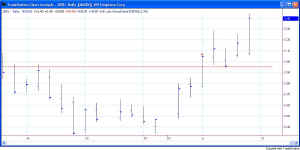
the downsloping trendline (drawn in magenta.) In fact, it spent most of last week bumping up against that line (resistance) without being able to make it over the line. That was a disappointment--and possibly a warning of weakness to come. In Figure 2, you can see that Friday's activity was
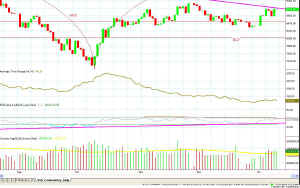
Figure 2 - Close-up of INDU showing Doji Bar
a small range from open to close, even though there was some intraday activity. In Japanese Candlestick terminology that's called a doji bar, and often portends a large move to come.
In the figure above I have drawn two horizontal lines, that I consider to be the Attractors for this chart, currently. The upper Attractor has stopped upward movement several times and the lower Attractor has caused prices to bounce back up several times. The blue line at the right hand edge of the chart is a 10-bar Linear Regression line. That means I am asking the computer to calculate the best fitting line through the data for the past 10 days. Clearly the line shows a nice upward ascent heading toward the upper Attractor. We are currently at 27.10, and I think we will make it to 28.25 this week on the QQQs. At that level, we will encounter resistance and either break through or reflect off. This time, I think we will break through.
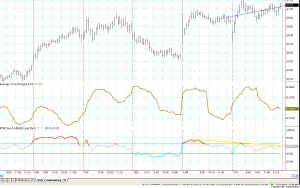
Likewise, in the 15-minute chart of the QQQs in Figure 4, I let the computer software draw the Linear Regression (LR) line automatically, but this time over a 30 period time frame. There are 27 bars during a trading day, on a 15-minute chart. I chose 30 to allow the line to slip into the previous day to account for any gap that might have occurred. You can see the nice upward slope of the LR line in Figure 4, but again prices are bumping up against resistance.
Enlarge the chart by clicking on it and take a look at the RSI. I have drawn a yellow trendline over the tops of the RSI indicator, and it forms a downward slope, while the price LR forms an upward slope. That's divergence. Often when that happens, price will go the direction of the diverging indicator, not the direction of previous price activity.
This probably means that intraday we will see some downside activity before attempting to slice through the overhead resistance. The Average True Range cycles back and forth throughout the day as prices have a higher range in the mornings and afternoons than during midday and lunch time. But, notice on the chart in Figure 4 that the ATR seems to be climbing as the tops are fairly consistent but the bottoms are rising into "higher waters." To me that means that brighter days are just around the corner.
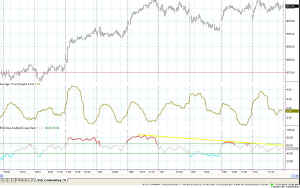
Even the S&P futures are bumping up against overhead resistance and can't seem to get through the heavy weight of emotional reluctance.
Usually (at least as I have observed it in the past) the move over the line will take the form of a fast and wide gap. Prices don't seem to just meander over a heavy resistance line, they either give up and trickle on downward or they give one big heavy push through the line.
TRADERS: I am expecting the heavy thrust upward through the overhead resistance. Usually, once that happens the follow through will be sputtering and weaker than the initial thrust, but if it is a real move upward (not just short covering) it will continue to move on up.
INVESTORS: My weekly model of the QQQs just gave a buy signal and the INDU (Dow Jones 30) is holding nicely above the 50 day moving average as it gets closer and closer to the 200-day MAV. I am now expecting a breakout on the indexes followed by a re-test of the breakout. To me that means its almost time to look for things to buy, instead of constantly shorting.
Nevertheless, as always, stay nimble, humble and take small losses and big wins.
![]() Don't miss
it--Sunny only gives a few trading seminars each
year. She calls them "Solving the Puzzle"
because she
puts all the pieces together into one cohesive plan for you to become a
better trader. Make it your business! View
the syllabus--she only takes 15 students. January 17-19, 2003.
AND..to match Larry Williams' offer, on Friday we will be trading real-time,
with real money. I will split the winnings with the
class, and if there are losses I'll keep them for myself. Just
think...the seminar could be free!
Don't miss
it--Sunny only gives a few trading seminars each
year. She calls them "Solving the Puzzle"
because she
puts all the pieces together into one cohesive plan for you to become a
better trader. Make it your business! View
the syllabus--she only takes 15 students. January 17-19, 2003.
AND..to match Larry Williams' offer, on Friday we will be trading real-time,
with real money. I will split the winnings with the
class, and if there are losses I'll keep them for myself. Just
think...the seminar could be free!
Weekly Stock Picks for the week beginning 1/13/2003:
| Symbol | Breakout | Stop Loss | Goal | Close if Triggered | Profit/Loss |
| TXN | 17.50 | 16.00 | 20.00 | ||
| ADBE | 28.70 | 27.00 | 30.00 | ||
| AMGN | 50.60 | 48.70 | 53.00 | ||
| APCC | 15.65 | 15.00 | 16.75 | ||
| CNXT | 1.76 | 1.60 | 1.90 | ||
| DISH | 26.45 | 25.00 | 29.50 | ||
| INTC | 17.55 | 16.50 | 19.00 | ||
| INTU | 51.00 | 48.25 | 52.50 | ||
| MCHP | 28.00 | 26.24 | 30.00 | ||
| QCOM | 39.00 | 35.00 | 44.00 | ||
| TOTAL |
ARCHIVE:
Weekly Stock Picks for the week beginning 1/5/2003:
| Symbol | Breakout | Stop Loss | Goal | Close if Triggered | Profit/Loss |
| UNM | mkt=18.25 | 17.49 | 19.11 | 19.02 | $770 |
| WPI | 29.50 | 27.44 | 33 | no | |
| AHLS | 0.83 | 0.50 | 1.4 | no | |
| ASDS | 0.46 | 0.37 | 0.6 | no | |
| CNXT | 1.85 | 1.5 | 2.5 | no | |
| JDSU | 2.95 | 2.38 | 3.5 | 3.40 | $450 |
| LGTO | 5.52 | 4.33 | 7.63 | 5.87 | $350 |
| MCHP | 26 | 24 | 30 | no | |
| PCAR | 48.3 | 46.3 | 51.6 | no | |
| RNWK | 4.06 | 3.5 | 5 | no | |
| TOTAL | $1,570 |
![]() AND... if you are a TradeStation user, you need to
attend "TradeStation Made Easy"
February 7-9, 2003. Sunny knows TradeStation and EasyLanguage
as only another Trader could, and the class is more engaging and jam
packed with useful information than any other class you can find, at any
price. Enroll
Now--she only takes 15 students. And, the same real-time
trading offer applies.
AND... if you are a TradeStation user, you need to
attend "TradeStation Made Easy"
February 7-9, 2003. Sunny knows TradeStation and EasyLanguage
as only another Trader could, and the class is more engaging and jam
packed with useful information than any other class you can find, at any
price. Enroll
Now--she only takes 15 students. And, the same real-time
trading offer applies.
