NAVIGATION:
| SSS Bulletin Board |
| How to use our commentary |
| FAQ |
| Member sign in |
| Free week guest |
| I want to read about the benefits |
| View Daily Archives |
| View Weekly Archives |

"The Sunny Side of the Street"
SUNDAY NIGHT--January 26, 2003
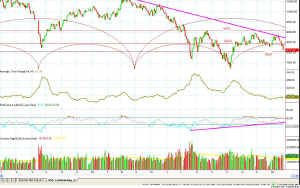
 Figure 1 - Daily chart of INDU w/ Cycles "The sky is falling, the sky is falling," cried Chicken Little. In measured response, the systematic trader softly spoke: "Sell sky." The Dow Jones Industrials (INDU) broke the long-standing lower Attractor of 8236 on Friday, by moving on down to 8131. That leaves the Dow wide open for a steeper down draft to the next lower Attractor which I am going to put at 8027. That's not very far away, but [more...] |
|
||||||||||||||||||||||||||||
[...more] with an important Attractor broken decisively, I think we are now "out of the box." The "box" is a rectangle--a narrow range channel that we have been trading in for more than 2 months. Of course, there is always the likelihood of a retest, but the Attractor at 8236 was broken, and that is an important clue as to the near-future movement in the indexes I watch.
My Dynamic Average indicator gave a quick whipsaw buy signal on the 23rd, but it was negated by my Sunny_Bands on the afternoon of the same day. The resulting short signal on the SPoos has so far yielded about $3,500 per contract on the model, and I am expecting further downside activity in the coming week.
The overlapping cycles I talked so much about last month are coming into play again in a big way. Both cycles have now topped and are beginning to round downward, as you can see in Figure 1. That will probably bring the indexes down as the pressure mounts. Extending the date forward by measuring the cycle span and then projecting ahead that many days takes the end of both cycles to the end of April 2003. So, that's when I am expecting to see a market bottom, and the beginning of a turnaround.
In the meantime, I am going to be watching carefully for the short plays and stepping very quickly when the model calls for long plays.
Notice in the table at the top of the page, where I give the market's closing prices and the "upper Attractor" and "lower Attractor", that the values have changed. Each of the indexes that I watch broke below their lower Attractors and now I have put new lower Attractors in place. Furthermore, in doing so, the previous lower Attractors became the new upper Attractors.
Although 8027 is only 104 points down from current levels, it is nevertheless the next logical stopping place. I am anticipating the Dow will linger there momentarily, forming some sort of whipsaw before it plunges on down for the next lower Attractor which will be at 7500. That Attractor was last tested in October, but we've also seen that number previously, just not for a long time. The last time the Dow was playing in the 7500 range (before October) was in September of '98. If the market dawdles around long enough in the range between 8450 and 7500, it could use time as the correcting agent rather than price, and clean up the overlapping cycles without doing too much harm.
In case you have any questions about just what I mean when I say some of these things in the Sunny Side of the Street, I am starting a new Bulletin Board for Subscribers. Since you never know when I am going to be in the Chat Room live, and I never know when you are going to be in the Chat Room waiting for me, I have decided to start a BB which will work like a guest book. You ask the questions, and I'll try to answer them. That way we will have a little interactivity that will benefit all readers. Usually if you have a question, others will as well, they're just too shy to ask it. Step up to the plate and let's get some discussion going.
As always, stay nimble, humble and take small losses and big wins.
![]() Don't miss
it--Sunny only gives a few trading seminars each
year. She calls them "Solving the Puzzle"
because she
puts all the pieces together into one cohesive plan for you to become a
better trader. Make it your business! View
the syllabus--she only takes 15 students. January 17-19, 2003.
AND..to match Larry Williams' offer, on Friday we will be trading real-time,
with real money. I will split the winnings with the
class, and if there are losses I'll keep them for myself. Just
think...the seminar could be free!
Don't miss
it--Sunny only gives a few trading seminars each
year. She calls them "Solving the Puzzle"
because she
puts all the pieces together into one cohesive plan for you to become a
better trader. Make it your business! View
the syllabus--she only takes 15 students. January 17-19, 2003.
AND..to match Larry Williams' offer, on Friday we will be trading real-time,
with real money. I will split the winnings with the
class, and if there are losses I'll keep them for myself. Just
think...the seminar could be free!
Weekly Stock Picks for the week beginning 1/13/2003:
| Symbol | Breakout | Stop Loss | Goal | Close if Triggered | Profit/Loss |
| TXN | 17.50 | 16.00 | 20.00 | ||
| ADBE | 28.70 | 27.00 | 30.00 | ||
| AMGN | 50.60 | 48.70 | 53.00 | ||
| APCC | 15.65 | 15.00 | 16.75 | ||
| CNXT | 1.76 | 1.60 | 1.90 | ||
| DISH | 26.45 | 25.00 | 29.50 | ||
| INTC | 17.55 | 16.50 | 19.00 | ||
| INTU | 51.00 | 48.25 | 52.50 | ||
| MCHP | 28.00 | 26.24 | 30.00 | ||
| QCOM | 39.00 | 35.00 | 44.00 | ||
| TOTAL |
ARCHIVE:
Weekly Stock Picks for the week beginning 1/5/2003:
| Symbol | Breakout | Stop Loss | Goal | Close if Triggered | Profit/Loss |
| UNM | mkt=18.25 | 17.49 | 19.11 | 19.02 | $770 |
| WPI | 29.50 | 27.44 | 33 | no | |
| AHLS | 0.83 | 0.50 | 1.4 | no | |
| ASDS | 0.46 | 0.37 | 0.6 | no | |
| CNXT | 1.85 | 1.5 | 2.5 | no | |
| JDSU | 2.95 | 2.38 | 3.5 | 3.40 | $450 |
| LGTO | 5.52 | 4.33 | 7.63 | 5.87 | $350 |
| MCHP | 26 | 24 | 30 | no | |
| PCAR | 48.3 | 46.3 | 51.6 | no | |
| RNWK | 4.06 | 3.5 | 5 | no | |
| TOTAL | $1,570 |
![]() AND... if you are a TradeStation user, you need to
attend "TradeStation Made Easy"
February 7-9, 2003. Sunny knows TradeStation and EasyLanguage
as only another Trader could, and the class is more engaging and jam
packed with useful information than any other class you can find, at any
price. Enroll
Now--she only takes 15 students. And, the same real-time
trading offer applies.
AND... if you are a TradeStation user, you need to
attend "TradeStation Made Easy"
February 7-9, 2003. Sunny knows TradeStation and EasyLanguage
as only another Trader could, and the class is more engaging and jam
packed with useful information than any other class you can find, at any
price. Enroll
Now--she only takes 15 students. And, the same real-time
trading offer applies.

