NAVIGATION:
| SSS Bulletin Board |
| How to use our commentary |
| FAQ |
| Member sign in |
| Free week guest |
| I want to read about the benefits |
| View Daily Archives |
| View Weekly Archives |

"The Sunny Side of the Street"
MONDAY NIGHT--February 3, 2003
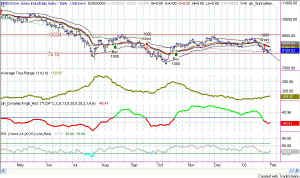
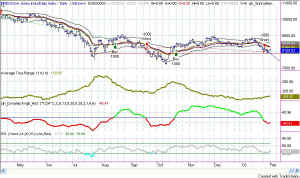 Figure 1 - Daily chart of $INDU More sideways action today. This is getting just too tedious. The 27 bar Linear Regression line on the 15-minute QQQ chart is as near to flat as it can be without actually being flat. [more...] |
|
||||||||||||||||||||||||||||
[...more]
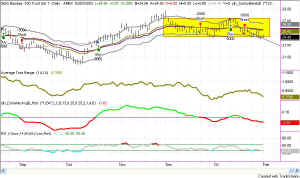
On the daily chart of the QQQs price is back inside the box. That's a good sign. I've mentioned in previous commentary that going much below this yellow box (Figure 2) would be a dangerous showing for the market, probably indicating more weakness to come. Today's rebound back inside the box possibly means that yesterday's adverse excursion was just an
overshoot. That happens sometimes. Nevertheless, my model is short on the daily chart (for investors), and it looks like that might be a weak move. Followers of my Dynamic Moving Average and Sunny_Bands will know that I use the middle bands as stops, and would exit any short positions if price comes up to touch the middle bands.
The Dow bounced nicely off the Attractor sitting at 7919 just as pretty as you please. That's a show of strength, though ever so small. My daily model for the Dow is also in a sell signal, but I'm beginning not to believe it. If this current activity is a turn, it's a huge oceanliner turning ever so slowly.
RSI on the Dow never did make it above the hopeful 65 line, but at least it seems to have taken a bounce as it hit the doubtful 40 line. That would be good news. Of late, turns in the RSI are long in forming, taking about 2 months in forming from top to bottom. If that pattern repeats we can expect the next 2 months to have an upward bias as the RSI climbs slowly back upward toward 65.
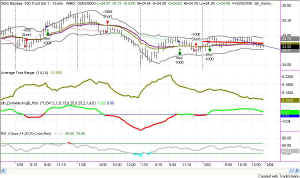
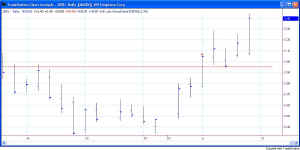
The red line in the last 27 bars of Figure 4 is a linear regression line. Linear regression is computed so that each data bar will be equally far away from the line in its error distance. So, in effect it goes right through the middle of the data. I use the linear regression indicator to get a quick look at the direction of the market, and to see changes in the direction of the market. I use 27 bars because that's how many 15-minute bars are in a trading day. Notice in Figure 3 that the linear regression line is just barely pointing downwards.
My ISP was off-line over the weekend and for most of today, so I was unable to watch the market in real-time and only able to get information from watching the ticker on CNBC. It was a helpless feeling, realizing just how technology dependent I and my job are. The ISP came back online about 4pm, and I am now able to view the market in retrospect. I find that my intraday QQQ model is in a buy signal, as are the Dow and the SPY. I am still in the long position I held over the weekend, as my hands were effectively tied behind my back today. Since I use TradeStation as one of my brokerages as well as my charting and analysis, I would only be able to make trades by phone (which I don't like to do anymore) based on information on a delayed ticker tape on the TV. But, as usually is the case, it all worked out. That's the position I want to be in at the moment anyway.
As always, stay nimble, humble and take small losses and big wins.
![]() Updated Seminar Schedule -- click here
for new dates. Several new breakthroughs in the past two
years have given me new material to share with those interested in the
"home business" of trading. On Trader Tech U I will be
giving a ten-week course on Indicators; in Carlsbad I will be
giving several back-to-back sessions of "Solving the Puzzle",
"TradeStation Made Easy" (including the use of the new
TS7), and "Advanced EasyLanguage."
Updated Seminar Schedule -- click here
for new dates. Several new breakthroughs in the past two
years have given me new material to share with those interested in the
"home business" of trading. On Trader Tech U I will be
giving a ten-week course on Indicators; in Carlsbad I will be
giving several back-to-back sessions of "Solving the Puzzle",
"TradeStation Made Easy" (including the use of the new
TS7), and "Advanced EasyLanguage."
Make it your business. What you don't know CAN hurt you.
Weekly Stock Picks for the week beginning 1/13/2003:
| Symbol | Breakout | Stop Loss | Goal | Close if Triggered | Profit/Loss |
| TXN | 17.50 | 16.00 | 20.00 | ||
| ADBE | 28.70 | 27.00 | 30.00 | ||
| AMGN | 50.60 | 48.70 | 53.00 | ||
| APCC | 15.65 | 15.00 | 16.75 | ||
| CNXT | 1.76 | 1.60 | 1.90 | ||
| DISH | 26.45 | 25.00 | 29.50 | ||
| INTC | 17.55 | 16.50 | 19.00 | ||
| INTU | 51.00 | 48.25 | 52.50 | ||
| MCHP | 28.00 | 26.24 | 30.00 | ||
| QCOM | 39.00 | 35.00 | 44.00 | ||
| TOTAL |
ARCHIVE:
Weekly Stock Picks for the week beginning 1/5/2003:
| Symbol | Breakout | Stop Loss | Goal | Close if Triggered | Profit/Loss |
| UNM | mkt=18.25 | 17.49 | 19.11 | 19.02 | $770 |
| WPI | 29.50 | 27.44 | 33 | no | |
| AHLS | 0.83 | 0.50 | 1.4 | no | |
| ASDS | 0.46 | 0.37 | 0.6 | no | |
| CNXT | 1.85 | 1.5 | 2.5 | no | |
| JDSU | 2.95 | 2.38 | 3.5 | 3.40 | $450 |
| LGTO | 5.52 | 4.33 | 7.63 | 5.87 | $350 |
| MCHP | 26 | 24 | 30 | no | |
| PCAR | 48.3 | 46.3 | 51.6 | no | |
| RNWK | 4.06 | 3.5 | 5 | no | |
| TOTAL | $1,570 |
![]() AND... if you are a TradeStation user, you need to
attend "TradeStation Made Easy"
February 7-9, 2003. Sunny knows TradeStation and EasyLanguage
as only another Trader could, and the class is more engaging and jam
packed with useful information than any other class you can find, at any
price. Enroll
Now--she only takes 15 students. And, the same real-time
trading offer applies.
AND... if you are a TradeStation user, you need to
attend "TradeStation Made Easy"
February 7-9, 2003. Sunny knows TradeStation and EasyLanguage
as only another Trader could, and the class is more engaging and jam
packed with useful information than any other class you can find, at any
price. Enroll
Now--she only takes 15 students. And, the same real-time
trading offer applies.
