NAVIGATION:
| SSS Bulletin Board |
| How to use our commentary |
| FAQ |
| Member sign in |
| Free week guest |
| I want to read about the benefits |
| View Daily Archives |
| View Weekly Archives |

"The Sunny Side of the Street"
TUESDAY NIGHT--February 4, 2003
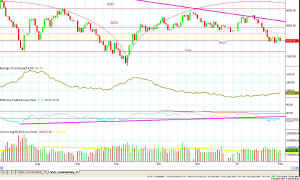
 Figure 1 - Daily chart of $INDU The looming double overlapping cycle has reached its peak and is now putting heavy pressure on the markets. Nevertheless, we had another day of sideways activity if you look at the larger, overall picture. [more...] |
|
||||||||||||||||||||||||||||
[...more]
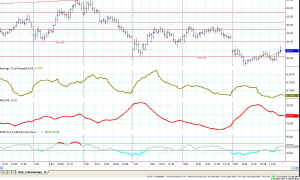
Due to the gap down opening, Tuesday's market was a down market. But, if you ignore the gap and look at the action for the remainder of the day you will see that all the activity was sideways choppiness with
the action centered around the Attractor at 24.04. It appears that until shown otherwise, the markets are intent on moving in sideways snaking movements. Not only are the movements sideways, but they seem usually to be contained in a narrow range, which makes them virtually untradable.
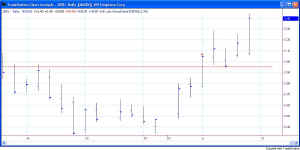
I would expect the QQQs to next move up to the 24.40 Attractor, with which it has been playing for many months now.
As always, stay nimble, humble and take small losses and big wins.
![]() Updated Seminar Schedule -- click here
for new dates. Several new breakthroughs in the past two
years have given me new material to share with those interested in the
"home business" of trading. On Trader Tech U I will be
giving a ten-week course on Indicators; in Carlsbad I will be
giving several back-to-back sessions of "Solving the Puzzle",
"TradeStation Made Easy" (including the use of the new
TS7), and "Advanced EasyLanguage."
Updated Seminar Schedule -- click here
for new dates. Several new breakthroughs in the past two
years have given me new material to share with those interested in the
"home business" of trading. On Trader Tech U I will be
giving a ten-week course on Indicators; in Carlsbad I will be
giving several back-to-back sessions of "Solving the Puzzle",
"TradeStation Made Easy" (including the use of the new
TS7), and "Advanced EasyLanguage."
Make it your business. What you don't know CAN hurt you.
Weekly Stock Picks for the week beginning 1/13/2003:
| Symbol | Breakout | Stop Loss | Goal | Close if Triggered | Profit/Loss |
| TXN | 17.50 | 16.00 | 20.00 | ||
| ADBE | 28.70 | 27.00 | 30.00 | ||
| AMGN | 50.60 | 48.70 | 53.00 | ||
| APCC | 15.65 | 15.00 | 16.75 | ||
| CNXT | 1.76 | 1.60 | 1.90 | ||
| DISH | 26.45 | 25.00 | 29.50 | ||
| INTC | 17.55 | 16.50 | 19.00 | ||
| INTU | 51.00 | 48.25 | 52.50 | ||
| MCHP | 28.00 | 26.24 | 30.00 | ||
| QCOM | 39.00 | 35.00 | 44.00 | ||
| TOTAL |
ARCHIVE:
Weekly Stock Picks for the week beginning 1/5/2003:
| Symbol | Breakout | Stop Loss | Goal | Close if Triggered | Profit/Loss |
| UNM | mkt=18.25 | 17.49 | 19.11 | 19.02 | $770 |
| WPI | 29.50 | 27.44 | 33 | no | |
| AHLS | 0.83 | 0.50 | 1.4 | no | |
| ASDS | 0.46 | 0.37 | 0.6 | no | |
| CNXT | 1.85 | 1.5 | 2.5 | no | |
| JDSU | 2.95 | 2.38 | 3.5 | 3.40 | $450 |
| LGTO | 5.52 | 4.33 | 7.63 | 5.87 | $350 |
| MCHP | 26 | 24 | 30 | no | |
| PCAR | 48.3 | 46.3 | 51.6 | no | |
| RNWK | 4.06 | 3.5 | 5 | no | |
| TOTAL | $1,570 |
![]() AND... if you are a TradeStation user, you need to
attend "TradeStation Made Easy"
February 7-9, 2003. Sunny knows TradeStation and EasyLanguage
as only another Trader could, and the class is more engaging and jam
packed with useful information than any other class you can find, at any
price. Enroll
Now--she only takes 15 students. And, the same real-time
trading offer applies.
AND... if you are a TradeStation user, you need to
attend "TradeStation Made Easy"
February 7-9, 2003. Sunny knows TradeStation and EasyLanguage
as only another Trader could, and the class is more engaging and jam
packed with useful information than any other class you can find, at any
price. Enroll
Now--she only takes 15 students. And, the same real-time
trading offer applies.


