NAVIGATION:
| SSS Bulletin Board |
| How to use our commentary |
| FAQ |
| Member sign in |
| Free week guest |
| I want to read about the benefits |
| View Daily Archives |
| View Weekly Archives |

"The Sunny Side of the Street"
MONDAY NIGHT--February 10, 2003
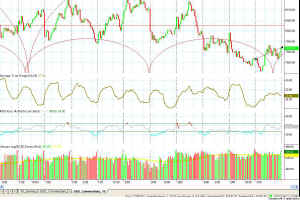
 Figure 1 - 15-minute chart of $INDU [click to enlarge] From my perspective, with respect to the long-term charts, today was just another addition to the sideways activity that has been taking place for the past two months. Remember when the Dow was moving 200 and 300 points a day? Compared to that, 55 points up seems like a pretty dull day. I still think that ... [more...] |
|
||||||||||||||||||||||||||||||
[...more]
... it is too early to be calling a bottom. The tendency of prices is still toward the down side, so I'm continuing to favor shorts over longs. All the while, I find myself hoping that prices will start going up--not because I want to get long, but because I see the potential damage that can be done to our economy.
War, and talk of war, makes investors nervous and unwilling to stick their necks out for any long-term holdings. The new moon is to be on the 2nd of March, which is when the experts say we are most likely to conduct strikes against Iraq--if we do. That in itself probably means two more weeks of sideways market activity.
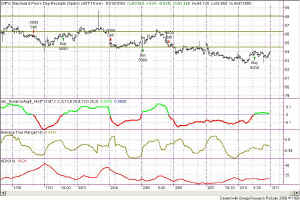
Figure 2 - SPY 15 minute [click to
enlarge]
Today's model gave a buy signal on the SPY midsession, but the market did not follow through. My Attractor is at 84.49 on the SPY, and today's close was at 83.94. That leaves a few cents on the table for tomorrow morning to either gap or run up to. That would be my expectation for short-term trading.
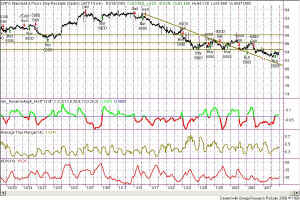
In Figure 3, take a look at the "long-term" trendline I've drawn on the 15-minute SPY chart. Price over the last 3-4 trading sessions has moved off of the downward trendline and now either needs to come back down to it, or start a new upward trend.
Figure 3 - SPY 15 minute Trendline [click to
enlarge]
The probabilities are on the side of the market hitting the upper Attractor and falling back down to or near the trendline.
So, as always, stay nimble, humble and take small losses and big wins.
![]() Updated Seminar Schedule -- click here
for new dates.
Updated Seminar Schedule -- click here
for new dates.
Weekly Stock Picks for the week beginning 2/09/2003:
| Symbol | Breakout | Stop Loss | Goal | Close if Triggered | Profit/Loss |
| ACV | 51.54 | 49.5 | 53.22 | ||
| ADSK | 15.45 | 14.81 | 16.13 | ||
| AGN | 62 | 60 | 64 | ||
| AMGN | 52 | 50 | 54 | ||
| QCOM | 38.37 | 36.67 | 40 | ||
| BDX | 33.5 | 32.5 | 34 | ||
| BEL | 7.88 | 7.06 | 9.3 | ||
| BGG | 43.6 | 42.35 | 45.48 | ||
| TOTAL |
![]()


