NAVIGATION:
| SSS Bulletin Board |
| How to use our commentary |
| FAQ |
| Member sign in |
| Free week guest |
| I want to read about the benefits |
| View Daily Archives |
| View Weekly Archives |

"The Sunny Side of the Street"
THURSDAY NIGHT--February 13, 2003
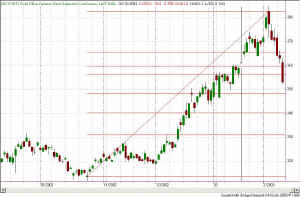
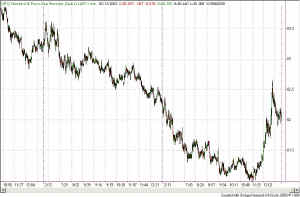 Figure 1 -1 Minute chart of SPY [click to enlarge] Seen on the web: "Thu
4:45pm ET - Reuters [more...] |
|
||||||||||||||||||||||||||||||
[more...]
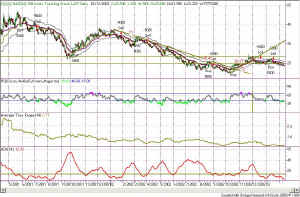
...most likely to have been short covering. Gold has dropped very quickly to the 353 level, and it looks to me like it is headed for 348, where the next Fibonacci retracement line lies. I expect a bounce from that level, probably on the same day we bomb Baghdad. (Figure 2).
Figure 2 - Daily Gold, continuous contract
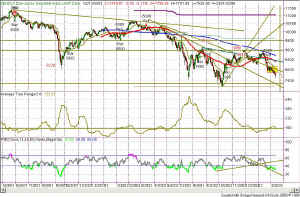
Having said so much in last night's commentary about my expectations for stock indexes (QQQ, SPY and INDU), there is not a whole lot left to say, except that today did just about as expected. Viewing the daily
bar for today on Figure 4 (INDU) it just looks like a strong downward bar. When viewing it from a 1-minute perspective it is clear that we had a downdraft followed by probable short-covering as no one really
wants to be caught holding positions overnight at this juncture. In last night's diatribe I suggested that the market will continue on downward, perhaps quite a bit, and I expect we will see much lower prices in the future. Dropping below the 8000 mark on the Dow is dangerous indeed.
My models are short the Dow daily and were short the Dow 15-minute as well, until late in the day today. At 12:15pPT today I issued an Alert saying I though the SPY was just about through with its updraft and that 82 would be a likely place for shorting. In fact, the upward move continued on to 82.52 before turning around and closing at 82.093. So, while my 15-minute model is theoretically long now, I am actually short, overriding the system in favor of Fibonacci retracements.
Now is not the time for investing -- now is the time for trading with great agility and in brief time periods.
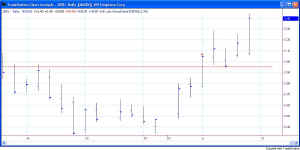
The daily QQQs chart shows ever decreasing ATR, currently down at 0.75, and the RSI having broken the 40 line into definite bear territory. The trendline on the RSI indicator is also sloping downward, compressing as it goes, showing the troublesome nature of the current market.
In summary, watch your intraday emails for SSS Alerts as I offer the occasional intraday educational material, and stay on your toes. I stand by my commentary of last night as my overall view for some time to come, unless something exceptional occurs that offers a compelling reason to reverse positions.
When and if a reversal does come, don't be afraid to take it--there is no pride of ownership when it comes to trading the markets. If new data makes it apparent that market conditions have changed, we jump at the opportunity--never argue with the market.
So, as always, stay nimble, humble and take small losses and big wins.
![]() Updated Seminar Schedule -- click here
for new dates.
Updated Seminar Schedule -- click here
for new dates.
Weekly Stock Picks for the week beginning 2/09/2003:
| Symbol | Breakout | Stop Loss | Goal | Close if Triggered | Profit/Loss |
| ACV | 51.54 | 49.5 | 53.22 | ||
| ADSK | 15.45 | 14.81 | 16.13 | ||
| AGN | 62 | 60 | 64 | ||
| AMGN | 52 | 50 | 54 | ||
| QCOM | 38.37 | 36.67 | 40 | ||
| BDX | 33.5 | 32.5 | 34 | ||
| BEL | 7.88 | 7.06 | 9.3 | ||
| BGG | 43.6 | 42.35 | 45.48 | ||
| TOTAL |
![]()
