NAVIGATION:
| SSS Bulletin Board |
| How to use our commentary |
| FAQ |
| Member sign in |
| Free week guest |
| I want to read about the benefits |
| View Daily Archives |
| View Weekly Archives |

"The Sunny Side of the Street"
TUESDAY NIGHT--February 18, 2003
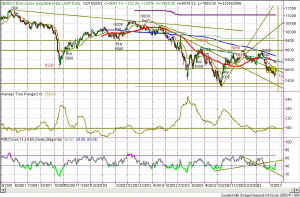
 Figure 1 -Daily INDU chart [click to enlarge] Today's up move took the Dow back inside the box, and nearly to the top of the box at that. Looking at Figure 2 you can readily see the boundaries of the box and that the top value is at 8386. Today's close at 8041 is a good push through the 8000 mark as well. I expect that tomorrow will... [more...] |
|
||||||||||||||||||||||||||||||
[more...]
have a continuation of this upward move, heading for the 8386 line.
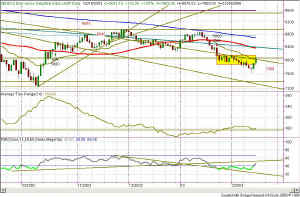
Figure 2 - Close-up of "the box"
Today's close was right at the Attractor lying at 8048 which stems from the highs of October 2002. Subsequent to that, the Dow found resistance at the same 8048 level during the end of January '03, as price vascillated back and forth around that level for 8 days. I also expect that price will hit the 8386 level and bounce back off of it to play inside the box just a bit longer. So, in short, I expect tomorrow to be an up day until it hits the 8149 level, and then to go back down in choppy fashion, but to not break below the 7853 mark.
Intraday the Dow was on a race for the top at the opening bell. From there on the remainder of the day was pretty much sideways. The same was true of the S&P and the QQQs with one exception. On the last bars of the day the SPY, DIA and SPH3 gave sell signals. But, the QQQ moved upward on the last bar, and as such did not give a sell signal, but stayed long. If this is a 1-2-3 movement, then the 4th wave would be choppy and would be the current wave. It could form a broadening pattern and stay choppy just a little bit longer, but I wouldn't expect it to go any lower than 84.50 SPY, 24.5 QQQ or 79.9 DIA.
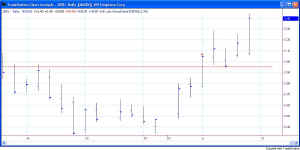
My 15-minute model was long since 11:45 on 2/13 and went short at the end of today except on the QQQ. If the QQQs move down on the first 15-min bar, I expect that model will go short as well. On a bit of a longer range (if you can call a couple of days long range) the QQQ has heavy resistance overhead at the 25.35 level. (See Figure 3)
Figure 3 - QQQ 15-minute showing resistance
RSI (at the bottom in Figure 3) has just displayed negative divergence with price (price moving upward while RSI was moving downward), which would confirm my suspicion of an up morning tomorrow followed by a sideways to down rest of the day.
Investors: my long-term INDU model is still in a sell signal, as is my SPH3 model and SPX model as well. The long-term model on the QQQs is short also, but had a whipsaw buy and sell in between the last meaningful sell. The markets are still holding lower than their 50 and 200 day moving averages, but the QQQ weekly chart just gave a buy signal. Nevertheless, as I said last week, if the SPX breaks below the 800 mark it could get into a scary descent toward the 676 level, where there is another Attractor.
So, as always, stay nimble, humble and take small losses and big wins.
![]() Updated Seminar Schedule -- click here
for new dates.
Updated Seminar Schedule -- click here
for new dates.
Weekly Stock Picks for the week beginning 2/17/2003:
| Symbol | Breakout | Stop Loss | Goal | Close if Triggered | Profit/Loss |
| ADI | 27.026 | 24.48 | 29.78 | ||
| AGN | 61.5 | 59.26 | 65 | ||
| ADM | 12.232 | 11.91 | 12.75 | ||
| APD | 40.98 | 40 | 43 | ||
| ASH | 28.096 | 26.89 | 29.82 | ||
| BBBY | 31.62 | 35.75 | 30.5 | ||
| BCC | 26 | 25 | 28 | ||
| TOTAL |
Weekly Stock Picks for the week beginning 2/09/2003:
| Symbol | Breakout | Stop Loss | Goal | Close if Triggered | Profit/Loss |
| ACV | 51.54 | 49.5 | 53.22 | 51.7 | 160 |
| AGN | 62 | 60 | 64 | no | |
| AMGN | 52 | 50 | 54 | 53.96 | 1960 |
| QCOM | 38.37 | 36.67 | 40 | 36.67 | -1700 |
| BDX | 33.5 | 32.5 | 34 | no | |
| BEL | 7.88 | 7.06 | 9.3 | 8.0 | 120 |
| BGG | 43.6 | 42.35 | 45.48 | no | |
| TOTAL | $540 |
![]()


