NAVIGATION:

SSS Bulletin Board
How to use our commentary 
FAQ
Member sign in
Free week guest  
I want to read about the benefits
View Daily Archives
View Weekly Archives

"The Sunny Side of the Street"

WEDNESDAY NIGHT--February 19, 2003
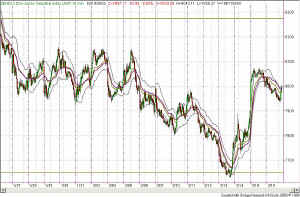
INDU_15_20030219.JPG (155872 bytes)
Figure 1 -15 minute INDU chart
[click to enlarge]

Yesterday I said that I suspected an up morning followed by a sideway to down rest of the day.  Today's markets gave only a tiny little up move before following through with the downward remainder of the day.  As the morning was pretty quick to turn down, the models of INDU, QQQ and SPY all are now short. 

[more...]  

symbol upper Attractor lower Attractor
INDU 9075 7650
QQQ 28.4 21.93
SPh03 875 815
GC 445 270

Visit (and frequent) the new SSS Bulletin Board, where you can post messages for Sunny and for other subscribers.

Nasdaq Intraday
Dow
Nasdaq
S&P 500
 

[more...]  

Even though the movement today was generally down, it only slightly dipped below the yellow box I have been watching on the daily chart.

QQQ_D_20030219.jpg (162963 bytes)
Figure 2 - QQQ Daily

The linear regression line on the right edge of the chart (blue) is sloping upward, which is counter to the intraday models' short positions. To me that would say that we are in for some more sideways action as the bulls and bears butt heads.

I just noticed another indicator on the chart in Figure 2 that could be of some importance.  There is a pennant inside the yellow box.  If you extend the line across the bottom of the pennant, you will see that we are just now hitting that line acting as resistance.  That would mean that we should try again tomorrow to break through resistance and either make a clean break -- or fail and fall back down to the 24.43 support.

Technically speaking, RSI has not gone below the 40 line appreciably into bearish territory; it sneaks a peek into that zone and immediately withdraws.  On the other hand, it doesn't get into bullish territory either, being turned back every time it comes up to the 65 zone.  On the daily chart, for the past 3 months, every time RSI touches 59 it turns back down.  That is a show of great weakness.  So, technically we can't say the market is weak, and we can't say it is strong either.

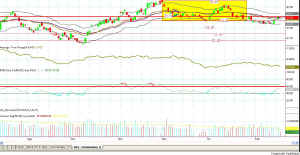
Today's market was turned back by the Attractor at the bottom of the most recent pennant, at 25.13.  (Figure 3).  And the top of yesterday's candle body stopped at the same place.
QQQ_D_20030219b.jpg (162554 bytes)
Figure 3 - QQQ Daily showing most recent pennant

You can also see on this chart that price is right on top of the midlines in the Sunny_Bands.  In other words, all these technical indicators show we are at a very important junction, where the market needs to show its hand and go one way or the other.  That's when it is time for breakout traders to step up to the plate.  Be ware and on your toes, ready for the breakout to go either way.  This is where I put limit orders on both sides of the market and let the market get me into the trade by breaking out.  Then I cancel the other order.
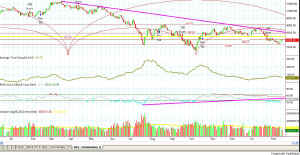
iINDU_D_20030219CYCLE.jpg (209991 bytes)
Figure 4 - INDU long-term overlapping cycles

We haven't talked about these overlapping cycles for a while.  Looking a Figure 4, you can see that both cycles are in downturn mode, putting extra pressure on the market to go down.  The smaller cycle peaked on 1/20/2003 and began the slow grind downward.  As they join in and get steeper as the near the conjunction, more pressure should result and the markets should continue to worsen over the next 2-3 months.  That is where I think we will hit a bottom, with the Dow at about 7250.  Each of the new lows on the weekly chart is accompanied by a volume surge, which to me shows capitulation and is essentially a positive note.

Average True Range is usually at its highest when the market hits these new lows, and then interest lags and ATR drops.  ATR shows a pretty cyclical nature to its evolution, and it is now nearing another low.  That says to me that we will soon see another leg up, but not before finishing the current move down within the cycle boundaries.

On the 15-minute SPY chart, today's price at the closing touched the top Sunny_Band in a virtually sideways Sunny_Band pattern.  For the most part, the SPY followed the lower band on down, until at 12:30pPT it jumped straight up into and then past the midline and right on to the upper band.  That was a show of strength making me alert to a possible run up, on the SPY, to 85.68.  Because of the mixed signals on the QQQ, INDU and SPY, anything is possible.  I think this is one of those times where they get out of synch temporarily. 

Take profits when you see them.  I think they will be small and short-lived for the next few days and the markets gyrate back into synch.

So, as always, stay nimble, humble  and take small losses and big wins.


   Updated Seminar Schedule -- click here for new dates.  


Weekly Stock Picks for the week beginning 2/17/2003:

Symbol Breakout Stop Loss Goal  Close if Triggered Profit/Loss
ADI 27.026 24.48 29.78
AGN 61.5 59.26 65
ADM 12.232 11.91 12.75
APD 40.98 40 43
ASH 28.096 26.89 29.82
BBBY 31.62 30.5 35.75
BCC 26 25 28
        TOTAL  

Weekly Stock Picks for the week beginning 2/09/2003:

Symbol Breakout Stop Loss Goal  Close if Triggered Profit/Loss
ACV 51.54 49.5 53.22 51.7 160
AGN 62 60 64 no
AMGN 52 50 54 53.96 1960
QCOM 38.37 36.67 40 36.67 -1700
BDX 33.5 32.5 34 no
BEL 7.88 7.06 9.3 8.0 120
BGG 43.6 42.35 45.48 no
        TOTAL $540


FAQ:  How do you decide whether the stock breaks out above the "Breakout" value listed in the table above.  For instance, it seems like you should have a loss on the stock symbol WPI for this week's picks.  ANSWER:  Let's hyperlink over to the Rules of Thumb in the Archives, so--click here.

JDSU Example Chart:  In this chart you can clearly see what I am observing when I prepare my "Weekend Stock Picks."  The Red Dot above January 6, 2003 shows the first 

JDSU_D_20030112.jpg (76375 bytes)
JDSU Daily Chart. 

day on which I could have entered this stock after my weekend alerts.  The horizontal line shows the price I listed as "Breakout."  The Breakout is a trigger price for me.  If the stock CLOSES above the horizontal trigger line, I buy the next morning on the open, if its price is still above the trigger line.

CHART OVERVIEW:  for the real scoop, visit Yahoo Finance


1 Day
Chart
5 Days
Chart
1 Year
     

Chart

Chart

Chart

Chart

Chart

Chart

Chart

Chart


DISCLAIMERS:

Statistics, tables, charts and other information on trading system monthly performance is hypothetical unless otherwise specified, and is based on the referenced systems hypothetical monthly performance as it would be executed through TradeStation Securities if per the contract/account balance and other specifications noted in the performance tables. Actual dollar and percentage gains/losses experienced by investors would depend on many factors not accounted for in these hypothetical statistics, including, but not limited to, starting account balances, market behavior, incidence of split fills and other variations in order execution, and the duration and extent of individual investor participation in the specified system. Fees, commissions, and other expenses are not accounted for herein, and will affect investors net results in actual trading. While the information and statistics given are believed to be complete and accurate, given the hypothetical specifications, we cannot guarantee their completeness or accuracy. THIS INFORMATION IS PROVIDED FOR EDUCATIONAL/ INFORMATIONAL PURPOSES ONLY. These results are not indicative of, and have no bearing on, any individual results that may be attained by the trading system in the future. PAST OR HYPOTHETICAL PERFORMANCE IS NOT INDICATIVE OF FUTURE RESULTS.

The CFTC requires the following disclosure statement in reference to hypothetical results:
HYPOTHETICAL PERFORMANCE RESULTS HAVE MANY INHERENT LIMITATIONS, SOME OF WHICH ARE DESCRIBED BELOW. NO REPRESENTATION IS BEING MADE THAT ANY ACCOUNT WILL OR IS LIKELY TO ACHIEVE PROFITS OR LOSSES SIMILAR TO THOSE SHOWN; IN FACT, THERE ARE FREQUENTLY SHARP DIFFERENCES BETWEEN HYPOTHETICAL PERFORMANCE RESULTS AND THE ACTUAL RESULTS SUBSEQUENTLY ACHIEVED BY ANY PARTICULAR TRADING PROGRAM. ONE OF THE LIMITATIONS OF HYPOTHETICAL PERFORMANCE RESULTS IS THAT THEY ARE GENERALLY PREPARED WITH THE BENEFIT OF HINDSIGHT. IN ADDITION, HYPOTHETICAL TRADING DOES NOT INVOLVE FINANCIAL RISK, AND NO HYPOTHETICAL TRADING RECORD CAN COMPLETELY ACCOUNT FOR THE IMPACT OF FINANCIAL RISK OF ACTUAL TRADING. FOR EXAMPLE, THE ABILITY TO WITHSTAND LOSSES OR TO ADHERE TO A PARTICULAR TRADING PROGRAM IN SPITE OF TRADING LOSSES ARE MATERIAL POINTS WHICH CAN ALSO ADVERSELY AFFECT ACTUAL TRADING RESULTS. THERE ARE NUMEROUS OTHER FACTORS RELATED TO THE MARKETS IN GENERAL OR TO THE IMPLEMENTATION OF ANY SPECIFIC TRADING PROGRAM WHICH CANNOT BE FULLY ACCOUNTED FOR IN THE PREPARATION OF HYPOTHETICAL PERFORMANCE RESULTS AND ALL WHICH CAN ADVERSELY AFFECT TRADING RESULTS.

These trading systems, like any other, may involve an inappropriate level of risk for prospective investors. THE RISK OF LOSS IN TRADING COMMODITY FUTURES AND OPTIONS CAN BE SUBSTANTIAL AND MAY NOT BE SUITABLE FOR ALL INVESTORS. Prior to purchasing a trading system from this or any other system vendor or investing in a trading system with a registered commodity trading representative, investors need to carefully consider whether such trading is suitable for them in light of their own specific financial condition. In some cases, futures accounts are subject to substantial charges for commission, management, incentive or advisory fees. It may be necessary for accounts subject to these charges to make substantial trading profits to avoid depletion or exhaustion of their assets. In addition, one should carefully study the accompanying prospectus, account forms, disclosure documents and/or risk disclosure statements required by the CFTC or NFA, which are provided directly by the system vendor and/or CTA's.

The information contained in this report is provided with the objective of "standardizing" trading systems performance measurements, and it is intended for educational /informational purposes only. All information is offered with the understanding that an investor considering purchasing or leasing a system must carry out his/her own research and due diligence in deciding whether to purchase or lease any trading system noted within or without this report. This report does not constitute a solicitation to purchase or invest in any trading system which may be mentioned herein. SUNNY HARRIS & ASSOCIATES, INC, SUNNY HARRIS and/or  DOYEN CAPITAL MANAGEMENT MAKE NO ENDORSEMENT OF THIS OR ANY OTHER TRADING SYSTEM NOR WARRANTS ITS PERFORMANCE. THIS IS NOT A SOLICITATION TO PURCHASE OR SUBSCRIBE TO ANY TRADING SYSTEM.
NO REFUNDS OF ANY KIND ARE OFFERED FOR PARTIAL USE OF THIS SUBSCRIPTION ONLY NEWSLETTER.