NAVIGATION:
| SSS Bulletin Board |
| How to use our commentary |
| FAQ |
| Member sign in |
| Free week guest |
| I want to read about the benefits |
| View Daily Archives |
| View Weekly Archives |

"The Sunny Side of the Street"
THURSDAY NIGHT--February 20, 2003
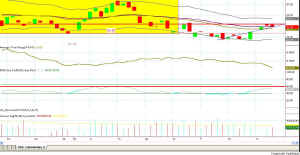
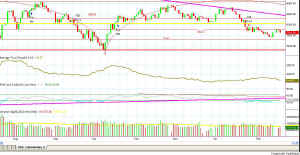 Figure 1 -Daily INDU chart [click to enlarge] The overlapping cycles continued to push down prices today and so did the overhead resistance at 8027 on the Dow (25.13 QQQ and 84.63 SPY). The lower shadow on the candlestick dipped into the midline on my Sunny_Bands but for the most part the day stayed above the midline of the bands. [more...] |
|
|||||||||||||||||||||||||||
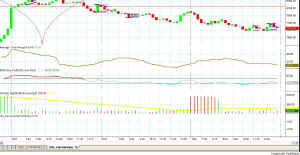
[more...] Figure 2 shows an enlarged view of the daily chart of QQQs. Notice that the red line which stopped today and yesterday's price action has been in place since I drew it on November 20th.
Price is still within the box which is the range I believe we will continue trading in until it is soundly broken. The top of the box is at 28.40 and the bottom at 24.40. I think with the cycles pushing downward that the market is more likely to break to the downside further. RSI continues to show weakness on every chart that I look at, although it is now just barely beginning to show a tiny bit of divergence. The ATR continues to contract, telling me that we should close the gap from three days ago, and probably continue on down to the 83.02 level on the SPY.
The QQQ has been the flattest of the trading vehicles I watch, meaning that it has been moving sideways in a narrow range, which makes it virtually untradable. When one instrument is untradable, jump to one that is tradable instead. Which one? I can hear you asking. Well, the
one with the highest PHW, of course. Remember PHW? That is the indicator I use to measure volatility, or range in an instrument. My students call it "yellow dots." TradeStation 6 does not have the RadarScreen capability that used to be in TradeStation 2000i, but since
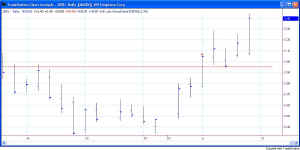
Figure 4- SPY 15-min w Yellow Dots (PHW)
I have kept both versions, with separate datafeeds, I still have RadarScreen. (BTW it is coming back in TS 7, which I am also using for Beta Testing, and it's wonderful.) So, to make that long story just a little longer, the SPY is currently at a higher PHW than QQQs, so that's another reason I have stepped over to trading the SPY for the moment.
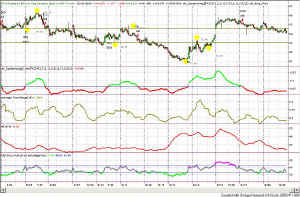
In Figure 3, above, take a look at the pennants drawn on the chart by my Pennant Indicator. The chart is a 15-minute Dow, and you can see how it has been steadily moving downward over the last 3 days. I want to call your attention to the two side by side pennants drawn toward the end of today. My way of trading pennants is to buy when price breaks above the top horizontal (red) line drawn at the beginning of the pennant or sell when price breaks below the bottom horizontal line. I then use the opposite line as a stop. Generally once price breaks the pennant it continues in that direction long enough to take a quick profit. Each time another pennant appears I move the stop up (or down in the case of a sell) to capture profits. I'll call those moves out tomorrow in email alerts if they happen.
So, long-term my models are still short, except for the QQQ whose weekly chart gave a buy signal. My model for Gold is still long, but any move below 341 will close the position.
Short-term my models for DIA, SPY and QQQ are all short. Price is staying below the mid Sunny_Bands and I expect a sharper move down tomorrow, pushing the bands on down toward the 83 SPY level.
So, as always, stay nimble, humble and take small losses and big wins, and may God bless.
![]() Updated Seminar Schedule -- click here
for new dates.
Updated Seminar Schedule -- click here
for new dates.
Weekly Stock Picks for the week beginning 2/17/2003:
| Symbol | Breakout | Stop Loss | Goal | Close if Triggered | Profit/Loss |
| ADI | 27.026 | 24.48 | 29.78 | ||
| AGN | 61.5 | 59.26 | 65 | ||
| ADM | 12.232 | 11.91 | 12.75 | ||
| APD | 40.98 | 40 | 43 | ||
| ASH | 28.096 | 26.89 | 29.82 | ||
| BBBY | 31.62 | 30.5 | 35.75 | ||
| BCC | 26 | 25 | 28 | ||
| TOTAL |
Weekly Stock Picks for the week beginning 2/09/2003:
| Symbol | Breakout | Stop Loss | Goal | Close if Triggered | Profit/Loss |
| ACV | 51.54 | 49.5 | 53.22 | 51.7 | 160 |
| AGN | 62 | 60 | 64 | no | |
| AMGN | 52 | 50 | 54 | 53.96 | 1960 |
| QCOM | 38.37 | 36.67 | 40 | 36.67 | -1700 |
| BDX | 33.5 | 32.5 | 34 | no | |
| BEL | 7.88 | 7.06 | 9.3 | 8.0 | 120 |
| BGG | 43.6 | 42.35 | 45.48 | no | |
| TOTAL | $540 |
![]()
