The Sunny Side of the Street

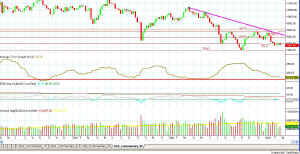
Figure 1- Weekly Chart of Dow [click to enlarge]
The weekly chart of the Dow in Figure 1 shows that we continue to tread along under the magenta trendline that was drawn on the two black squares since May of 2001. The market has tested that line a couple of times, once not so successfully, and might now be moving upwards to test it again. If that is so, the Dow needs to break the 8500 mark pretty soon, or it will tumble on down to the 7500 mark instead. If I had drawn the line on the bottom you could see that this is also a broadening formation, that could just as easily be calling the market downward. So, in short, the markets are pretty confused as to what to do from day to day. This keeps the market action in constant flux with one day up and the next day down--in a very narrow range. First it looks like we will hit the lower band in the next few days, then it looks like we are turning around and will become bullish. Yet, all that really happens is fear of trading for longer than a few minutes for being wary of war breaking out.
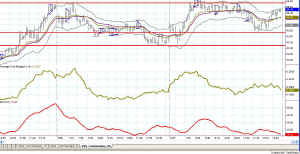
The Daily chart and 5-minute charts show a clearer picture of today's market action. The day started down briefly, then bounced off the Attractor to move up quickly to the boundary (call it B1) set by yesterday's intraday high. Most of the remainder

Figure 2- QQQ chart, 5 minute time frame
of the day was spent going sideways at that level until about 11:30am when the market dropped back down to the Attractor formed by the previous day's mean pivot line (call it B2). The market bounced off of that line and headed right back to the boundary B1.
I traded a little bit in the confusion, pulling off a long from the bounce through B2 and holding only for a few minutes when we hit B1. I sat on the side lines for the rest of the day until we started pulling away from B1, when I decided to go short. I didn't see anything really compelling to take me out of my short position, so I'll open Friday morning holding a short position from overnight.
The pennant formed at the end of Thursday afternoon could, of course, go either way, but I'm expecting a quick opening gap down, where I'll get out of the short position.
