The Sunny Side of the Street
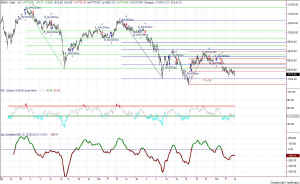
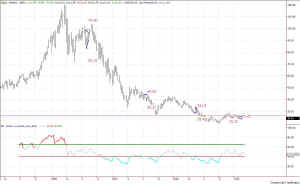
Figure 1- Daily QQQ [click to enlarge]
If you draw enough lines, some of them will eventually line up. That's what I think when I see charts with lines drawn all over them (like the one I drew in Figure 1.) Price is going to hit some of those lines, somewhere. Well, there is actually more to it than that in many cases. In Figure 1 I have drawn Fibonacci retracement lines on the major moves to see whether they speak to me. Is the market giving any clues about the direction of its next move? In yesterday's commentary I thought the market would display a single trade today, in the downward direction, and alas, it just chopped up the sideways channel again today. I just stayed short. I'm not fond of whipsaw trading and trying to catch the scalping trades. It's not my nature. That type of trading is for 20 and 30-somethings who have lots of adrenaline to spare and are sure they can conquer the world.
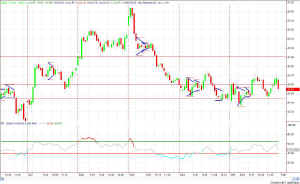
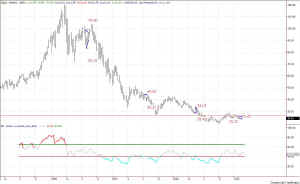
Figure 2- 15-minute QQQ [click to enlarge]
Today's choppiness is clear on the intraday chart in Figure 2. After a few choppy days the market has to move somewhere, and my guess is still down.
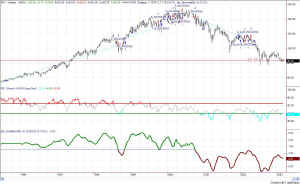
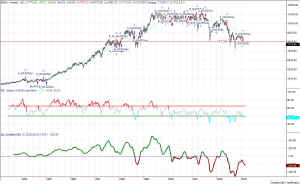
Each of these figures has a horizontal line that most market activity is currently centering around. The encouraging part is that the markets are not plummeting south, but are spinning around the horizontal lines. But, it's impossible to trade this kind of market. You can see on the enlargements of
these charts that each time we have had a major market correction that the same sort of churning and spinning takes place. Congestion tends to accompany market turns.
Keeping in mind the long-term, overall view of the markets is important in the trading of the intraday charts. When markets are churning, it is important not to expect large beefy up or down moves that line your pockets, but rather, to trade on small accumulative profits. That is what I like about using the ATR. It gives us a measurement by which to tell about how much the markets have been moving in an average move, and thus what to expect from
the market moves in the near future. Again, it is no dictum, just an aid. What really happens in the markets is what dictates your action.
I am expecting the Dow will test the 7529 level before it makes a run for the 8100 Gann level. The turning points for tomorrow's action look to be:
| symbol | low pivot | high pivot |
| QQQ | 24.20 | 24.90 |
| SPY | 82.21 | 84.50 |
| INDU | 7633 | 7851 |
