The Sunny Side of the Street

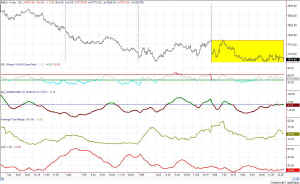
Figure 1- 5-minute INDU [click to enlarge]
It wasn't much of a down day, but again, it wasn't much of an up day either. Except for a little excitement on some apparent rumors early in the day, the market moved in the narrowest channel I've seen in a long time. The trading market was much like this in 1991 around the time before and later on during the Gulf War. It was an impossible year for traders, and better for longish-term shorters. That seems to be what we are seeing here.

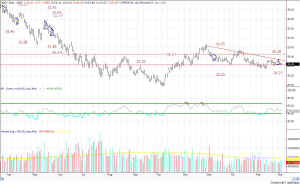
Figure 2- Daily QQQ
Basis the daily charts, my models are short the markets, playing the game of who can sit this out the longest. The QQQ chart above, in Figure 2, shows the congestion the market is still in, not moving much past its pennant, and doing it on low volume. I keep seeing articles with headlines like "When not saying anything says a lot." In other words, everyone sees the market at a dead still, probably waiting for news of war or dismissal thereof. Will we, or won't we?
The QQQs broke down just below the horizontal pennant line today, but only on an intraday basis. If a market breaks below the pennant line, it's a signal to go short, or to stay short in our case. But, the signal is not valid until it is activated on a daily close, and the QQQs closed above the line. This critical line I'm watching is at the value 24.27.

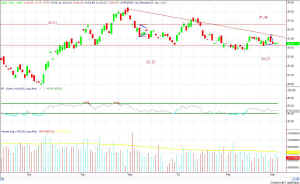
Figure 3- Daily QQQs enlarged, candlestick style
Looking at Figure 3, I have changed the style of the data to Candlestick and have narrowed the focus to a smaller segment of time. You'll notice more easily that the bodies of the candles seem to line up with the Attractor, while the shadows ("wicks") dip lower. If the body doesn't close under the line of observation, I don't act on it.
==<:>==