The Sunny Side of the Street

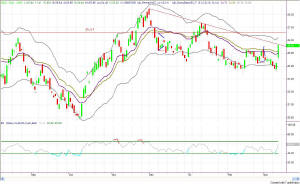
Figure 1- Daily QQQ [click to enlarge]
As I said in last night's commentary, my Dynamic Average turned yesterday into a buy signal. And, what a nice one it turned out to be today! Not only did today's market head for the 24.60 mark, but it far exceeded that mark and pushed up against a trendline (drawn in Figure 1 above) emanating from 12/2/2002 and 1/13/2003. There is just a little bit of room left to completely touch that trendline, so I expect it will be taken care of by left-over orders tomorrow morning. Will we once again see irrational exuberance? Sure--someday, but markets don't usually turn on a dime and tomorrow is probably not the beginning of the next great bull market.
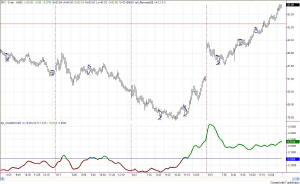
Figure 2 shows how smoothly and deliberately the market moved up today. Interestingly, however, is my new indicator (OscillatorA) shown at the bottom of the chart--after the initial move up, the oscillator didn't go higher, but piddled along sideways.
Where next? In Figure 1 you can see that price is now above the midlines of the SunnyBands, but has not yet touched the top band. I would expect the market to at least make a run for the top band, which currently lies at 26.22. There is an attractor lying just above that, at 26.61, which was last visited on 6/20/2002.
The daily charts are still in sell formation, so that says all buying should be cautious buying with one foot on the accelerator and one on the brake.
==<:>==

