The Sunny Side of the Street
 |
|
|
| 1 year | 1 week | 1 day |
Friday's market action was another day of positive action in the markets, making this the eighth up day in a row. Quite a record in recent times, with Friday closing up more than 231 points. Of the last 8 up days, the average range has been 124 points. The previous 8 day's average range was -44 points, just to give you an idea of how dramatically things have changed.
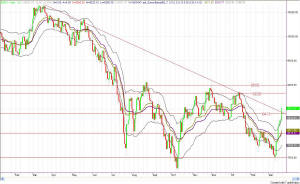
In Figure 1 you can see that the long-term trendline emanating from 3/19/2002 has at last been broken to the upside. In addition to the break above the trendline, another encouraging factor is that the low of the previous down move (8 days ago) ended at 7500, higher than the previous low. The definition of an up trend is higher lows and higher highs. So, now we have a higher low, we have yet to see higher highs, but that would be the next goal. The first resistance in the up climb would be at 8836, and after that 9000.
Also evident in Figure 1 is the decisive breaking of the SunnyBands. Price is now above the bands, pushing upward. The long-term charts, via my models, went into buy signals on the 19th, and are now sitting on a nice profit. When prices go above the SunnyBands, I then begin to watch closely for price to begin to back off and touch the midline. If, or when, it gets to that level, I get out. In a sideways market that does nothing but limit losses, but in a market with sharp steady directional moves, that technique will preserve profits.
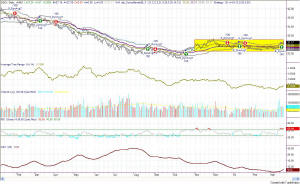
So far, despite strong moves up over the last 8 days, we are still in a sideways market. The narrow yellow box contains all the price movement for the past 5 months, and the ADX is just now beginning a slight turn upward. Note, however, that ADX is only at a value of about 9, and is not yet above 20; so, I'm not yet counting this as an up move on the long-term charts. On the short-term charts, that's another story.
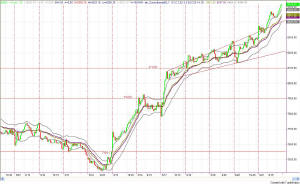
Just last week I was talking about the broadening formation on the chart in Figure 3 and mentioned that usually that would mean a reversal pattern. However, that because of the strength in the war in Iraq that I expected the market to continue its move on upward. And, that's just what it has done. Friday's move on the 15-minute charts put it well our above the broadening formation and above the SunnyBands.
On these short-term charts, my models went into
buy mode on the 17th, and are now holding long from 8012 on the Dow, 26.81
on the QQQs, and 87.60 on the SPY. It's still a choppy market, not much over
its long-term sideways action, and a market in which to be very cautious.
So, while this looks like a sure thing at the moment, don't let your guard down. I'm still jumpy and taking profits when I see them, as price retreats and touches the SunnyBands. Then if it wants to go higher, I go back in for another run, and again get out when I see profits.
There are Attractors looming overhead that could rapidly pull price up to them, but just as quickly repel them when they get there. Be wary around Attractors. Magnetism pushes and pulls both ways.
==<:>==


