The Sunny Side of the Street

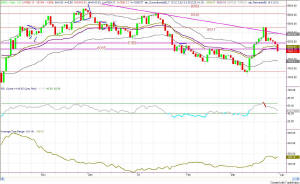
Figure 1- INDU Daily
In yesterday's commentary I said:
- "Much of the movement in the recent markets has been found in a single bar drop, or rise, with the remainder of the day being just choppy and sideways. One big bar followed by a bunch of little ones seems to be the pattern.
- With that in mind, it would make sense for tomorrow to be a quick drop to 8035 on the Dow with the rest of the day, or even the remainder of the week, just dribbling around that line."
Today dropped with two large bars and spent the remainder of the day in
sideways and upward choppiness. The day ended with the Sunny Dynamic
Moving Average right on the 8035 line which I submitted to you yesterday.
The market itself dropped lower, in fact considerably lower, than
that--getting as far down as 7929 on the Dow, with the close being at 7991.

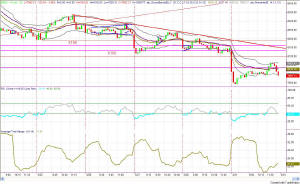
Figure 2-- Dow Jones 15-min intraday activity
In Figure 2 you can see that the Dow Jones dropped and then popped. Prices dropped quickly in the opening few bars, and then popped back upward for most of the rest of the day. Price is now well underneath the downsloping trendline I had drawn starting 3/25.
The drop and pop movement gave the intraday RSI time to drop below the
bearish zone at 40 and begin to head back upward, putting it more in synch
with the daily RSI.
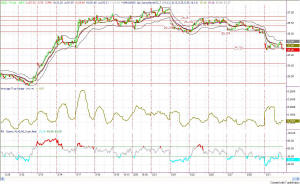
In Figure 3 you can clearly see that when the intraday QQQs dropped through the 26.37 Attractor on 3/27 they stayed underneath. Today's lows on the intraday QQQ closely approximated the lows from 3/17, hitting the Attractor formed back with the Feb 28-Mar3 highs. Of course, the question now becomes: will it bounce or drop through?

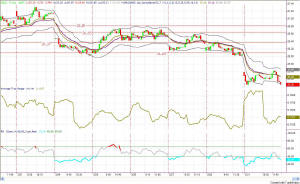
Figure 4-- QQQ 15-min Broader view
I think ultimately the QQQs are headed for the Attractors at 24.60, but for now are likely to play a little more in the sideways channel first.
For tomorrow I expect the QQQs will try to close the open gap formed this morning, by first going to the SunnyBand at 25.66. Some heavy good news on the Iraqi front would send the market on up to close the gap at 26.09, but I don't think the market will have enough momentum to do that on its own without good news. The longer term look is still drifting sideways inside the yellow box we have been viewing for weeks, the bottom of which is at about 23.00. The lower SunnyBand on the daily chart is at 24.22 and that's about a low as I imagine it will go over the next 3-4 days.
==<:>==
