The Sunny Side of the Street

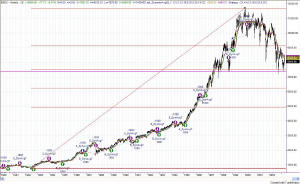
Figure 1- INDU Weekly
I probably should save the long-term, weekly, chart in Figure 1 for a weekend discussion, where I could wax long and pontificate on the meaning of life as related to the stock market. But, for one of those unknown reasons, I felt prompted tonight to take a look at the weekly chart.
Since most agree that the longest bull run was the recent one which started in 1982 and ended on the highs of Jan 2000, I decided to pull a Fibonacci retracement from those two points and see what the indicator/tool would show me.
For months now I have had the magenta line drawn at 7387 on the Dow. Looking at the Fibonacci retracements, the .382 line comes in at 7523, nearly the same value when looking from this long-term perspective. I tend to think mine will be a bit more accurate because it is drawn from actual lows, rather than calculated lows, but there it is.
My Dynamic Moving Average has been short basis this weekly chart since Mar 3, 2000, and is still holding steady in that short position.
In Monday's commentary I said:
- "I think ultimately the QQQs are headed for the Attractors at 24.60, but
for now are likely to play a little more in the sideways channel first. For tomorrow
(Tuesday) I expect the QQQs will try to close the open gap formed this
morning, by first going to the SunnyBand at 25.66."
- And, that's exactly where it went. And stopped. That's about all we could wring out of the QQQs today, a lously little 33 cents move.
Average True Range on the daily QQQ chart is 78 cents, so you would think we could see at least that much, but it wasn't going to be today.
That
sort of intraday weakness will take the daily ATR down even more, and makes
me think that there is still more weakness to come. Actually it
doesn't feel like weakness, it feel like lack of commitment. Still
waiting for proof of strength in the Iraqi war keeps traders glued to the TV
set, which is probably exactly where we will find Saddam Hussein--glued to
CNN, watching every move we make and announce.

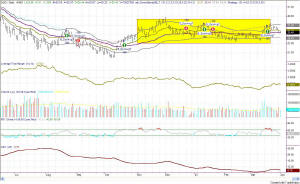
Figure 2-- QQQ Daily activity
In the QQQ daily chart the market action continues to plow along sideways, in just about lunar cycles.
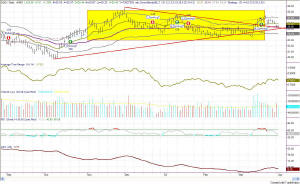
The current cycle has lost its momentum and seems to be waning, until you
draw two little trend lines, shown in Figure 3, which is a close-up of
Figure 2.

Figure 3-- QQQ Daily closeup.
With the price below the midline of the Sunny_Band I'm not looking to go long yet. I would wait for it to go into positive territory and start pushing the upper band upward first. So, just keep watching for now and act only on information, not on premonitions.
==<:>==