The Sunny Side of the Street

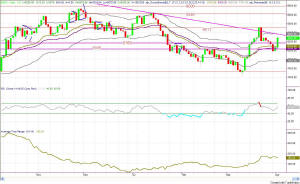
Figure 1-- INDU Daily Chart (Click to enlarge)
In last night's commentary I said:
- "This could mean an up-move in the making. Two more days and price will be at the conjunction of these two lines and could come bouncing right out of there in a fast move up to about 27.04, which is the top Sunny_Band."
The high on today's QQQ was 26.56, not quite making it to 27.04, just a half point away. And again, the move was characterized by one strong push and the remainder of the day moving narrowly across the chart, in a primarily sideways move. The only way to catch a move like the market has been seeing lately is to be in the position before it happens. So often these moves are happening on a gap down or in this case a gap up, that following a mechanical system with great discipline is the only way to keep yourself in tune and away from emotions.

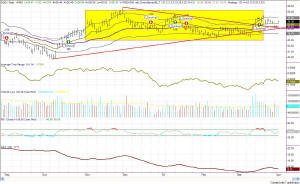
Figure 2-- QQQ Daily Chart (Click to enlarge)
On the daily chart of the QQQ (Figure 2) you can see the gap jump that took today's market over the hump and into positive territory. There is now a single bar sitting all alone in territory on the positive side of the SunnyBands. The SunnyBands themselves are moving sideways, so it is too early for me to say this is a new up move. Until the bands turn upwards, I'm not calling this anything but a continuation of the sideways movement in the yellow box.

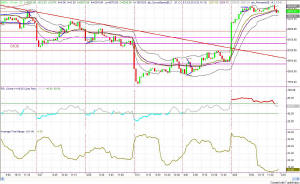
Figure 3-- INDU 15-min Chart (Click to enlarge)
The top of the SunnyBands now lies at 27.02, which is where I expect to see tomorrow's movement go. I am expecting a move similar to that we experienced after 3/13 in tomorrow's market.
The only worrisome technical indicator is at the end of Figure 3, where you can see the 15-minute RSI in divergence with price. That will give the move a bit of a struggle, especially with RSI in overbought territory. But, RSI can stay in overbought and oversold territory for long periods of time, so I don't expect that this single indicator spells the end of the upmove just yet.
==<:>==