The Sunny Side of the Street
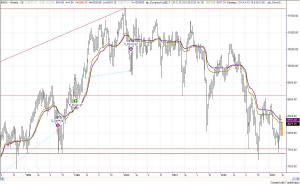
Figure 1-- INDU Weekly Chart (Click to enlarge)
What have you done for me lately? That's what came to mind as I sat down to think about tonight's commentary and what the market has done over the last week. And, the answer is--nothing, really to speak of. The chart in Figure 1 is a weekly chart of the Dow Jones, showing that this week's bar is lower than last week's bar. Once again, the market is going nowhere and it is going there very slowly.
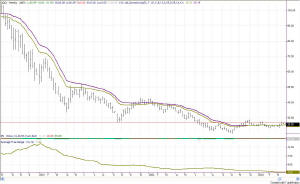
Generally this sort of action is typical of bottoming or topping action. I know, I have been saying this for weeks, but what else can I say when the market continues to repeat and repeat the same sort of action? You can see it even more clearly by looking at a weekly chart of the QQQs, in Figure 2.
In Figure 2 you can readily see that market action has dried up and gone home. In mathematics, the right-hand side of this chart looks like a hyperbole. A hyperbole is a conic section consisting of two open branches each extending to infinity. In the case of the stock market, if you view the NASDAQ from its high in March 2000 to present, in Figure 3, you can see that there was a fast descent downward (along the Y-axis, if you will) followed by slower and slower movement along what is now the X-axis. An hyperbole
on the right hand side of the chart would extend in this flattened out position for ever--into infinity. And, that's the way the market has been acting.
In a lecture I gave about 8 years ago I was asked what I thought the market might do if it became all computerized and mechanical. I replied that one definite possibility would be for the market to just go flat, as computers have no fear and greed to add to the mix. Maybe that's what is happening.
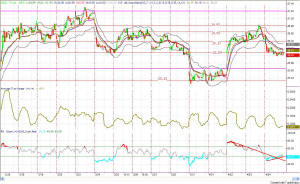
Figure 4-- QQQ 15-min chart
My read of the short-term (15-min) chart in Figure 4 is that we now have positive divergence between price and the RSI, saying technically that tomorrow's action should be moving upward to the Attractor at 26.37.
The current QQQ ATR is at about 0.7, the last price on the QQQs was 26.09, thus tomorrow's aim could be up even further, to 26.78.
The last price on the daily QQQ chart was a quick touch and a bounce off the midline SunnyBand, which makes me think it will bounce tomorrow off that midline and try once again to touch the top line. That top SunnyBand lies at 26.95.
With three prices to aim for (26.37, 26.78 and 26.95), all of which are above current prices, it looks to me like tomorrow should be an up day.
Remembering the yellow box, however, it bears repeating that the prices on the QQQ are still mumbling around in the box and have not made any serious attempts lately to break out of the box. I think it is about time to head one
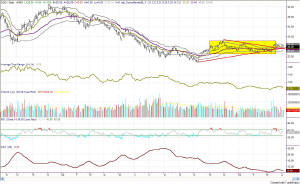
Figure 5-- QQQ Daily with the yellow box
direction or another.
==<:>==
