The Sunny Side of the Street
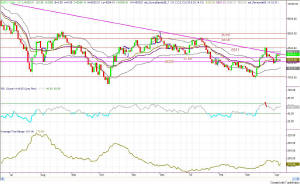
Figure 1-- Dow Daily Chart (Click to enlarge)
The Dow closed up 23+ points today, at 8300.41. The current daily Average True Range is 172 points, so this performance is quite a bit off the average. To me that says that there is more room on the upside for tomorrow's market.
The most interesting part of today's move, to me, is that upward motion was stopped firmly at the trendline emanating from March 2002--which I have been following and talking about for months now. (Click on the chart in Figure 1 to view the details.)
The high on the bar chart perspective of today's movement was just about stopped by the Attractor at 8511. Again, one of those amazing feats of numerical magic. Now, comes the test. From the strength shown by this move, the next ploy is usually to test the trendline that was just broken. Support becomes resistance and resistance becomes support. So--now we can watch for any move up to be countered by
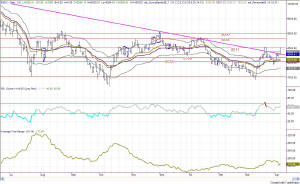
Figure 2-- INDU bar chart Attractor at 8511
an attack on 8511 to see if it holds the support it should.
RSI on the daily chart is at 57, pointing up (not down). That says to me that price will move up, pulling the RSI up to at least 65, which is the bottom of the bullish range. That should put the Dow at about 8648.
Using traditional Elliott Wave calculations, it looks like we have put in the 1 wave and now the 2 wave and are working on the 3 wave. Using my spreadsheet Elliott calculator, that puts the top of the 3-wave at about 9612 on the INDU. That sounds pretty outlandish from where we now stand, but if this is going to be anything like a bull market, that's where is has to go. Take a look at Figure 3.
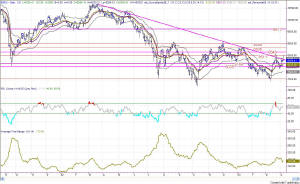
Figure 3-- INDU longer term to see 3-wave
If the Dow could make it to that level, it would be testing the support (which becomes resistance) from January 2002. That makes sense, but the markets will be hard pressed to make the move out of the channel we have been stuck in for so long. The top of the box is at about 8836-9000, so when prices get to that level, be ready to jump ship, or double up--depending on what the market does in response to the Attractor.
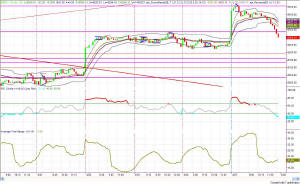
Figure 4-- INDU 15-minute chart
However, if we back out and take a longer term perspective, it is of great interest to note that today's action stopped right at the upper limit formed on 3/24 at about 8520. That noted, we now must back out further and see if there is something else we can diagnose to get even more information, and for that we need to go back to the daily charts.
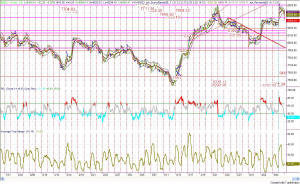
Figure 5-- INDU 15-min longer term view
That takes us back to the daily chart in Figure 2, where the Attractor line at 8511 goes all the way back to 9/21/2001 for its formation, and this time I am looking at the bottom of the SunnyBands, not the bottom of price.
Something's gotta give. But what? Let's go even further back, and look at a weekly chart of the Dow, in Figure 6.
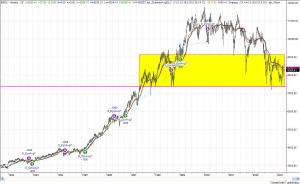
What I see here is still a big, complex Head-and-Shoulders pattern, waiting to break down or bounce and continue the long-term move upward. This is a critical juncture for the world economy. To me, the monthly chart of the Dow shows it all. In this next chart I have used semi-log scaling so that we have a meaningful dollar-for-dollar view of the markets, and I have drawn the trendline off of the significant highs and lows for the last eighty years! This is a critical chart, shown in Figure 7.
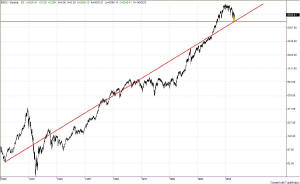
Figure 7-- Monthly Dow chart showing lower prices to come.
Notice on the left of the chart that the crash of 1929 shows in proportion to its significance at the time, because of the semi-log scaling. The trendline also touches the tops of prices all along, including pre-1987 and 1989 crash. So, you can see that this is a very important trendline.
Now, at the end of prices on this chart, I have drawn a yellow box, where price will probably go. It will most likely finish out this trendline that has been holding true for the past eighty years. And, that puts price down at 6666 on the Dow!
Because price won't just drop to that level from today to tomorrow (it ages like a fine cheese) and it matures with time, by the time enough time passes to get to the trendline, price and the line will likely touch each other at about 7500 on the Dow.
It is from that point that I believe we will take the next leg up in continuation of natures next bull market. And, it looks from that chart like it will start in about the beginning of 2005. Between now and then, we most likely (from my view) have a lot of sideways choppiness to contend with, and small scalping trades, not long run trends.
Get used to it. Yuck.
==<:>==
