The Sunny Side of the Street
My thoughts about the market last night were certainly off base. I've been right on target day after day in the near past, but last night I said:
- "The Attractor at 8169 is close to the SunnyBands midline at 8134, which is where I would get protective on the downside profits, if there are any.
- RSI is moving up nicely on the daily and the intraday charts, and I expect that shows some strength for tomorrow's movement, which I believe will be upward."
Today's market was just the opposite--it went down in a show of weakness, nearly hitting the lower Attractor.
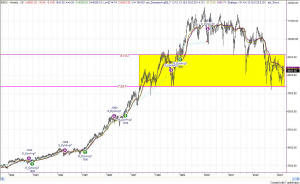
Week after week after week the Dow stays within the yellow box. Today's market action didn't change that in the least. The Sunny Dynamic Moving Average has been in sell mode since March 2000, and I expect it will stay in that position until and unless the Dow breaks above 9150. It may be many more weeks in the making, but at some point the market must test this huge Head-and-Shoulders formation. Either it will bounce off of 7387 and move strongly upward for weeks and months, or it will collapse below 7387 and move down the H&S measurement of 3500 points, taking the market to a pathetic 3347. Only time will tell. In the meantime, we continue to trade both long and short, keeping in mind that the direction of the market can and does reverse on a dime.

Figure 2-- Dow Daily
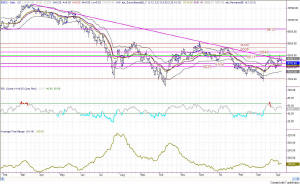
Today's drop on the daily chart of the Dow stopped short of touching the Attractor at 8169. RSI is now right in the middle of the range, at 52.87, holding steady and ready to move either direction. The trendline sloping downward across the chart in Figure 2 has stopped all upward action for more than a year. But, over the last week or so it has been penetrated 4 times. As slight as this might look to the casual viewer, I think it is encouraging and hopeful to see the breaks, as they point to the potential for further upward movement.
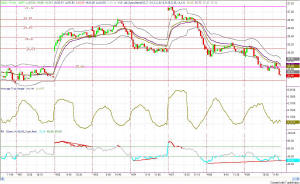
The intraday chart steadily moved downward all day, nearly touching the lower Attractor at 25.33. The SunnyBands and the Sunny Dynamic Moving Average have been short the 15-minute model for 2.5 days, capturing a nice profit on today's move. Now I expect a bounce to occur at the Attractor (25.33) so be alert and ready to hold onto short profits. But, on the other hand, stay at the ready in case the QQQs continue to drop further. If the QQQ drops below the Attractor it should move pretty fast.
The formation that stands out to me, on all of the charts, is the compression happening as pennants and triangle form on every time frame. These formations are not characteristic of a falling market, but rather of a market which is trying to change direction. I keep thinking the markets are bottoming and trying to move upward, and yet the strength is not yet there. The war, the economy, the news... on and on with the excuses. It's too soon to be exuberant, but the signs of upward movement are there.
==<:>==

