The Sunny Side of the Street

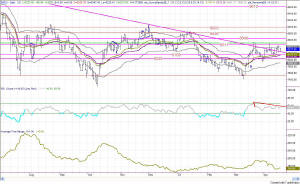
Figure 1-- Daily Dow
In last night's commentary I said:
- "I think we might be in for a little more bumping and grinding, as the market is carving out a spot just above the SDMA upperband and the midline, and I don't think the sell signal issued by today's bands is a good one. I think the signal will be reversed tomorrow with another run for 26.65 on the QQQs, and possibly even 26.81."
Today's QQQ moved smoothly upward until 10:30am, at which time it hit the skids at the 26.90 area. Last night's quote was, once again, right on target. You can't ask for accuracy any better than that!
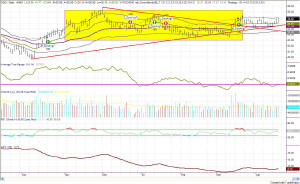
The daily QQQ chart is still in the yellow box, with the pre-holiday close creating just a bit of an outside bar. This formation is said to be generally a reversal pattern.

Figure 2-- Daily QQQ chart with Yellow Box
A reversal of what, you might ask? Well, technically it's supposed to be a trend reversal, and since technically there is no real trend in here ... how do you reverse it? Since the QQQs (daily) are currently at the top SunnyBand, and the most recent trendline is beneath the current price (see Figure 2), that leads me to believe that the reversal would be a reflection down from the SunnyBand, toward the previous trendline.
That trendline currently lies at about 25.59 on the QQQs, whose most recent close was at 26.82. That would give a little more than a point of downward action for Monday (the next open).
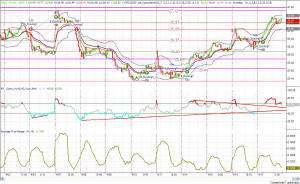
From the looks of the 15-minute QQQ chart, in Figure 2, it has just about formed a triple top (also look at the daily chart) and has the highest probabilities of reflecting off of that line and going down now to that 25.59, or 26.09 level. It may take as

Figure 2-- QQQ 15-minute chart
much as three days to get there, but that's what the picture looks like from here.
If the market, instead, breaks through the upper resistance and goes up, it will have to make an attempt at running for that 28 area on the QQQs.
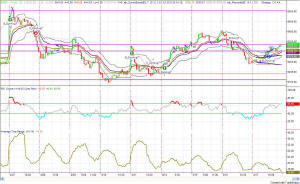
The Dow (Figure 3) just broke through resistance at 8336 on the intraday chart, so it will follow suit Monday and tumble back down off this line, or it will start a new leg up, and the QQQs will follow it. This of course remains to be seen.
Given the tendency of the markets to trade sideways since 11/02, I would rather place my bet on continued sideways movement until proven otherwise.
What do I mean by "until proven otherwise?" If the markets start upward, and continue upward strongly, I would get out of my short positions. Do not doubt, or try to second guess, the market direction. When the market speaks, listen.
==<:>==
