The Sunny Side of the Street
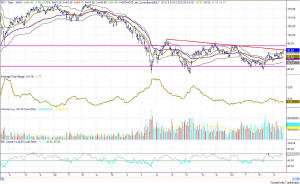
Figure 1-- Daily SPY
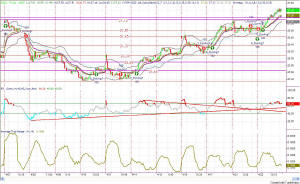
Figure 3-- QQQ 15-minute chart
Several days ago I said that I didn't believe the sell signal issued by the SDMA was a good signal. By that, obviously, I meant that I was favoring the buy side and reluctant to take that sell signal. Today was the reason why.
I said in that commentary that:
- "I think the signal will be reversed tomorrow with another run for 26.65 on the QQQs, and possibly even 26.81."
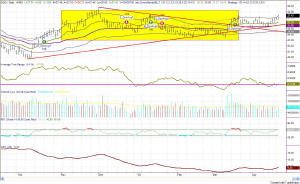
Today's QQQ made a run for it, like in the good ole days. It even pushed on up toward the top of the yellow box that I have been talking about, whose top is at the 28.30 level. The high on today's QQQs was 27.46, just beyond the close. With that in mind, let's add the ATR to it and we get 28.17--which is likely where we will see the market exploring tomorrow.
Don't get over-confident, however. In all likelihood, the market will play with the top of the yellow box briefly and then fall back downward.
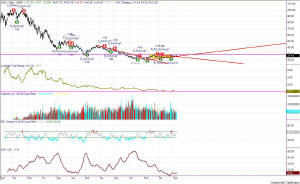
Why? Well, let's look at a bigger picture--a more long-term view. In Figure 5, I have a chart of the daily QQQs compressed so we can see farther back in time. I have placed a magenta, horizontal line on the top of the yellow box, and let it extend to the left. There you will see both support and resistance at that level from Sept 2001 (very important), May 2002 and June 2002.
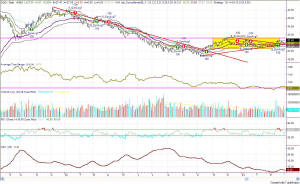
Figure 5-- QQQ Daily longer term
And, in fact, if you scale back so you can see 3 years, in Figure 6, you will see that what we are experiencing right at the moment looks more like a little bit of congestion coming up against some pretty tight resistance.
It would be very surprising if the market gets through that resistance on the first try. Can it be done? Sure. It has happened before, but usually in strong bull markets. Nevertheless, even though the slope is not very great, the trend is up at the moment.
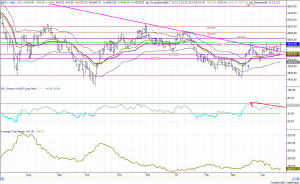
I put the SPY in the Figure 1 position because it ended today so nicely right on the trendline. That configuration would speak to potential retracement, or at least backing and filling in the near future.
If the triangle is a continuation pattern, and the previous trend was down, then the current triangle should resolve in another downside movement. Tomorrow? No, not necessarily, but soon. By my calculations it would take the SPY down to the 85 area over the next two months.
Unless, of course, the triangle is broken to the upside, and then it is time to get long and ride the next wave upward. But, that won't be revealed to us until it happens.
Let the market tell you what it is going
to do before jumping in. Never try to be a top or bottom picker.
Leave that to the gamblers.
==<:>==
