The Sunny Side of the Street

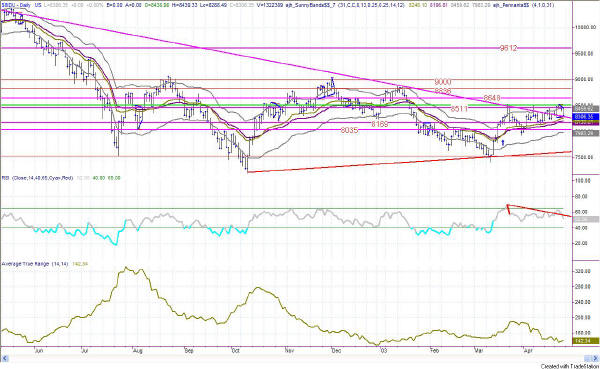
Figure 1-- Daily Dow
On the last bar of the chart in Figure 1 you can see that the Dow dropped exactly to its trendline and stopped. That trendline, which goes back to 3/19/2002 was violated last week, and now has to be tested. We may experience several days of testing this trendline and then drop through it, or bounce up off of it. These next few days are critical to the market, dictating the future, near-term trend.
The highs over the past few days were at 8522 on the Dow, effectively stopped from further up movement by the resistance lines at 8522-8550.
The technical pattern most evident on the chart is a large Head and Shoulders pattern, the neckline of which is drawn in a red trendline in Figure 1. The resolution of that should be to come down and retest the neckline and then either drop the measured distance (peak to neckline) or bounce back up and continue climbing. The next few days will tell us which it is going to be.
For the moment I am short, anticipating the move down to the neckline, which should be about 7600-7800 on the Dow. If the market speaks a different tune, I will know by the breaking of the line of resistance overhead at 8550. Then, I will abandon the shorts and go long instead, for a ride to about 9000.

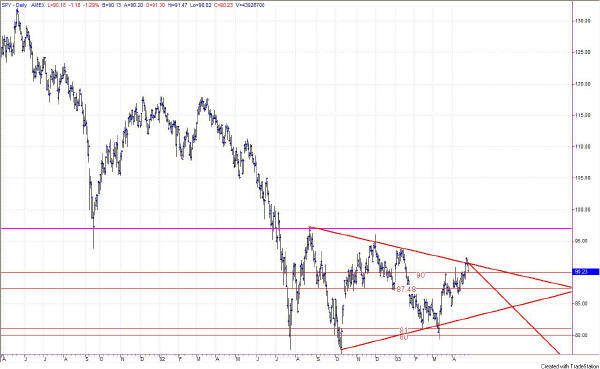
Figure 2-- SPY Daily
In Figure 2 you can see the same story with a little different twist. In addition to a H&S pattern, we have a pennant or triangle formation, which is generally interpreted as a continuation pattern. Continuation of what? Of the previous direction--which was down. So, the resolution here should also be down to the upsloping trendline , which when adding in the time factor should take the SPY down to about 85 in the next few months.
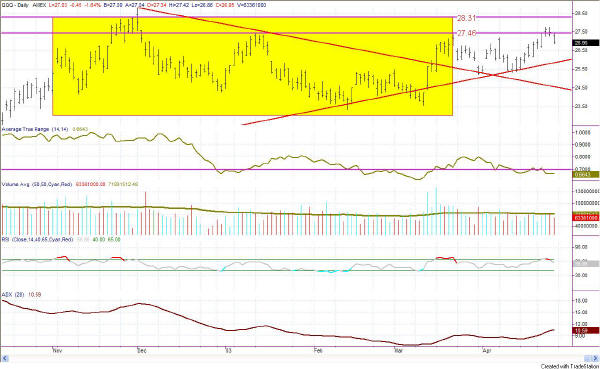
Same story here, on the QQQ daily chart in Figure 3. Last week's action couldn't make it as far up as the top of the yellow box, but instead stopped and reversed at the 27.46 level. At a minimum I expect price to drop to the upsloping trendline beneath current market levels, which would put the QQQ at about 26 in the relatively near future. If it breaks that level, then it is likely to move on down to the downsloping trendline, and end up at about 24.50, or maybe even lower to test the bottom of the box.
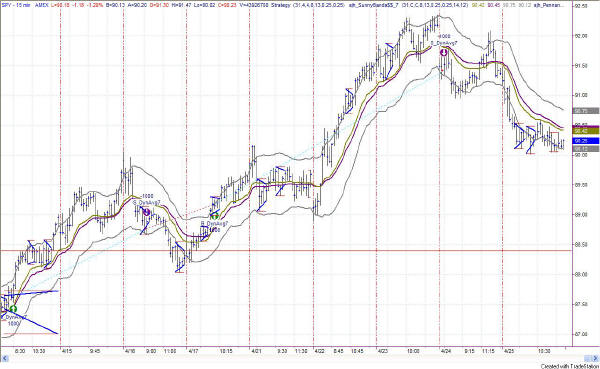
On an intraday basis, my model has been short the SPY for the last two days, and the Sunny_Dynamic_Moving_Average (SDMA) does not yet show signs of wanting to change course and go up. So, it's short the short-term and short the long-term charts for the moment.
==<:>==

