The Sunny Side of the Street
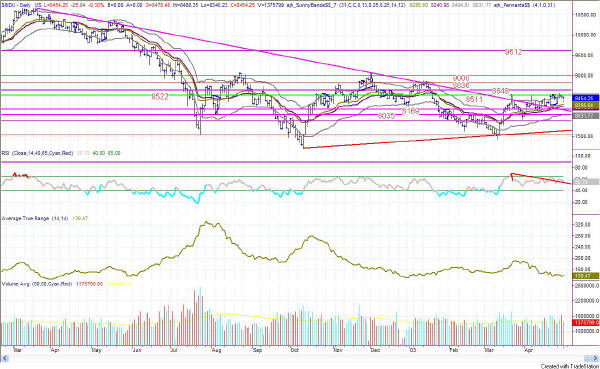
Figure 1: Daily INDU
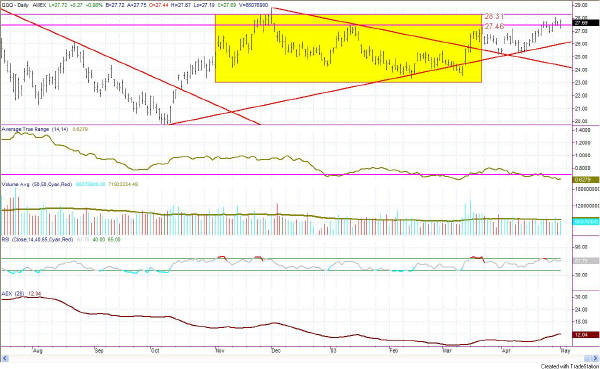
Second verse, same as the first. Today was a bit of a down day, as I have been expecting and talking about herein for weeks now. On the QQQ and INDU daily chart it echos my thoughts about falling down to the trendline. The divergence on the RSI still stands and I'm still looking for more action on the downside.
In Figure 2 you can clearly see that today's action left an island top in prices, which could very easily signal quite a bit of movement pending on the downside.
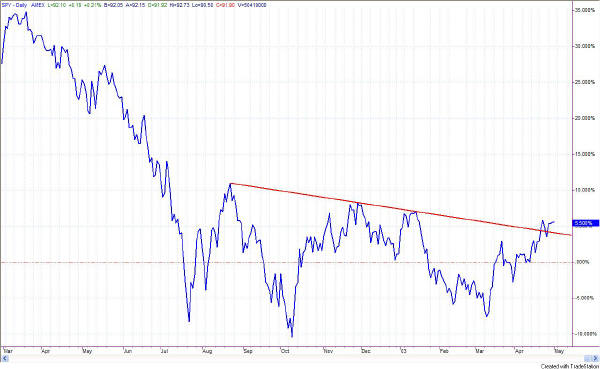
The chart of the SPY in Figure 3, however, shows only closing prices joined by a line, and is clearly a break of the former trendline. That pattern is positive (a) because it broke the trendline and (b) because there is an inverse Head-and-Shoulders pattern extant which just broke above the neckline. That could bode significant upside movement on the S&P which would pull all the other markets along with it. I still am in wait and see mode until the yellow box is broken.
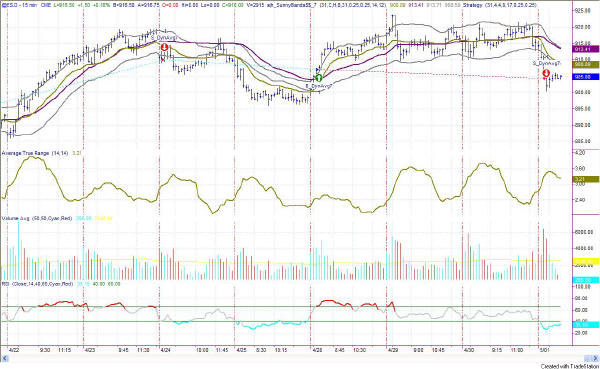
Figure 4: E-Mini 15 minute intraday
In Figure 4 the E-Mini took a dive today and stopped with a pennant formation. Pennants on lower volume (which this is) are said to resolve in the direction of the previous trend (or flagpole) -- which is more on the downside.
So, for tomorrow, my guess is more action on the downside. Two other pointers: the market was moving down today when the CME electronic trading went offline, so there could be sell orders waiting for tomorrow morning's execution. And, 2) the old adage "buy the rumor, sell the news" could come into play tomorrow morning as the day after the Bush "war is over" speech.
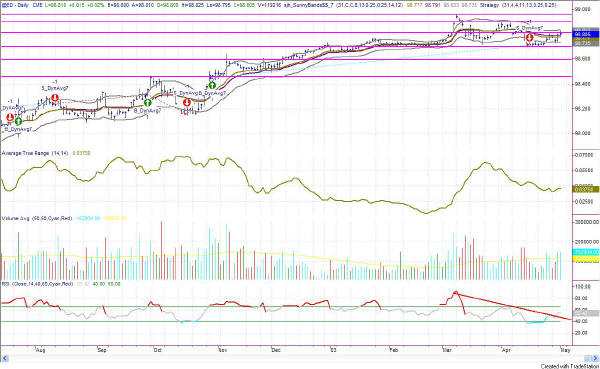
No change here. Currencies follow long-term patterns of trending, and as yet this one has not broken upward to violate the sell signal. If it goes above 98.81 this is still a short play.
| Subscribe now to The Sunny Side of the Street and SAVE. If you are receiving this commentary as part of the one-week trial and subscribe before the week runs out, your subscription will be only $99.95 per month, for as long as you are a continuous subscriber. If you wait, the regular subscription price is $139.95/month, which is still a great value! | |
| Consider this, how much can you lose on a single trade? How much should you pay for good advice? | |
| Like the indicators I use in this commentary? If you are a TradeStation user, you can have them on your computer, so you can follow along intraday! | |
| Need a MENTOR? Sunny is available for hourly consultation, or for extended studies. Call (888) 68-SUNNY...that's (888) 687-8669. |
I still stand by my previous commentaries watching for the markets to start
a trek downwards in the near future.
Nevertheless, if any of these equity markets I report on breaks above the "yellow box" tops, it is indication to change our tune and watch for upward movement instead.
RULES OF THUMB:
1. When price is pushing the upper Sunny_Bands upward and then eases off and moves back toward the midline, it's time to take profits. If it starts moving up and pushing on the Sunny_Bands again, it's time to get back in. Likewise, if the market is pushing down on the lower Sunny_Band and eases off to move back to the midline, it's time to take profits from the short play.
2. Divergence of the RSI and price is another good time to take profits and wait for a breakout of price before taking a position.
3. When the exchange puts in curbs or trading halts on a large move down, it usually (not always) stops the downward motion. After the market reopens is a good time to take profits from your short position.
==<:>==
While it may be true that a picture is worth a thousand words, it is definitely not true that a picture deserves a thousand words.
I have been asked by one of my subscribers to comment on a currency and the E-Mini, as part of this service. If any of the rest of you agree, please email me so I will know whether others want this service as well. (sunny@moneymentor.com) However, as part of including two more markets, I cannot say as many words about each chart without taking all day. I will of necessity be more to the point and succinct. Nevertheless, I will continue to point out critical Technical Analysis constructs and things that I see, and how I read them on each of the charts. I think adding the EuroDollar and the E-Mini are a good idea for some diversity.
