The Sunny Side of the Street
SUNDAY NIGHT - May 4, 2003
(Click on any chart to make it larger.)
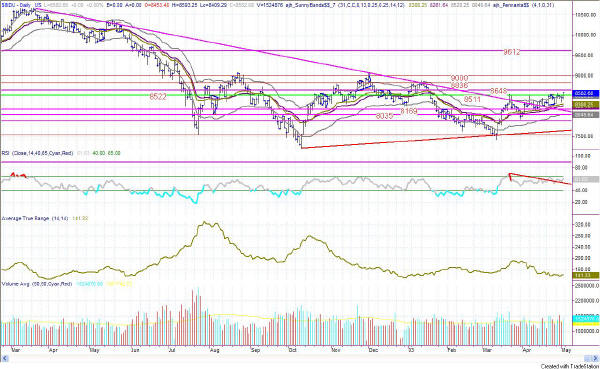
Figure 1: Daily INDU
The Dow is beginning to show signs of positive breakouts from the longstanding sideways trend. The trendline sloping upward underneath this complex Head-and-Shoulders pattern should still be an Attractor. If it doesn't become a failed pattern, and the market goes back down to touch the line, it is currently sitting at about 7626 on the Dow. That's about 900 points down from here. Will be go there? Only time will tell. The H&S pattern fails about as much as it is successful.
The encouraging line on the long-term Dow chart is the magenta line coming from the far left side. This line slopes downward since March 2002 and was only broken last month, for the first time in more than a year.
A market trend is defined by a move of 20% or more. For instance,
we are in a Bear market if the market under observation has moved down 20%
or more from its high. This one definitely fits, having moved 38.7%
off its high on the Dow, and even more than that on the NASDAQ. A Bull
market then, is one that has moved 20% or more off its low. The low in
the Dow was on 10/11/2002 at 7197, and the high of this past week was 8593.
To move 20% up off of that low we need to get to 8637. We are almost
there, but not quite, on the Dow. So, we are very near to an important
juncture where we will define a new bull market, or a continuing sideways
market. Will it, or won't it go above the 20% mark? That is the
question.
| Subscribe now to The Sunny Side of the Street and SAVE. If you are receiving this commentary as part of the one-week trial and subscribe before the week runs out, your subscription will be only $99.95 per month, for as long as you are a continuous subscriber. If you wait, the regular subscription price is $139.95/month, which is still a great value! | |
| Consider this, how much can you lose on a single trade? How much should you pay for good advice? | |
| Like the indicators I use in this commentary? If you are a TradeStation user, you can have them on your computer, so you can follow along intraday! | |
| Need a MENTOR? Sunny is available for hourly consultation, or for extended studies. Call (888) 68-SUNNY...that's (888) 687-8669. |
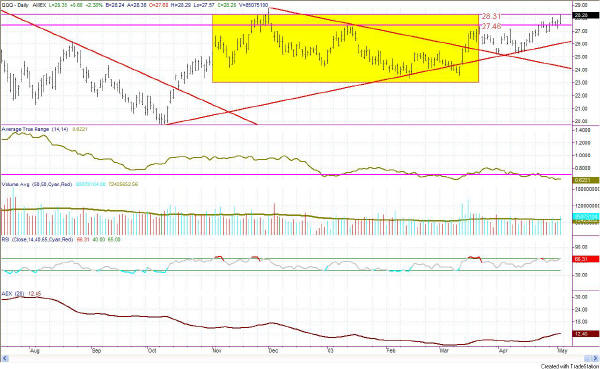
Figure 2: QQQ Daily
The high on Friday's QQQ bar was just short of the top of the yellow box by 0.02 points, ending near the high. The intraday move up was positive and strong, but it is still happening on decreasing volume. Either we will burst through the resistance, or be turned back away from it. The only clues we have are from reading the technical patterns and indicators on the chart.
The Average True Range is still diminishing; The RSI is lingering in overbought territory, but has formed a slight divergence with price; volume is lower than average.
Interestingly, the ADX's +DMI is indicating that the daily QQQ is now in an uptrend, basis the 14-day ADX. But, counter to that, the yearly (260-day) Linear Regression Line is sloping downward, showing that the trend for the past 12 months is still down.
As a Technical Analyst, I am still of the opinion that we are in a sideways market. Until we pass through the 28.31 line on the QQQs, we are still in a sideways market. But, as soon as we pass that mark, my tune will change. Will I become wildly bullish? No. Not until the most recent high on 12/2/2002 at 28.79 is surpassed.
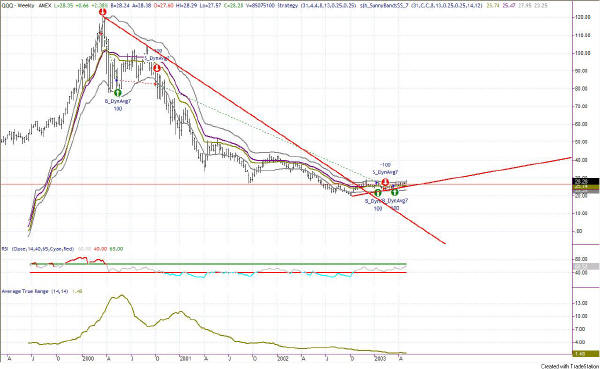
Using the same kind of Bull vs Bear market analysis as I did for Figure 1, the NASDAQ (QQQ) has moved from a high on 3/24/2000 of 120.50 down to a low of 19.76 on 10/11/2002. Percentage-wise that's a move of -84%. From that low, the market is now at 28.29 on this week's high, which is a 43% move upward, which qualifies it as a bull market. But, if you will step back and just look at the chart in Figure 3 from a visual perspective, it doesn't look like much of a bull market. It does look like a bottoming formation; it also looks a bit like a Cup-with-Handle. But, bull market? I don't think so; not yet.
Nevertheless, my Sunny_DynamicMovingAverage has moved into a buy signal, albeit after a false buy and a false sell signal preceding it, which happens in sideways markets. The SunnyBands have gotten more and more narrow, indicating congestion, and just this week price popped up outside the bands. That is another very positive sign. Furthermore, RSI has not topped out yet; there is still more room at the top for additional moves upward.
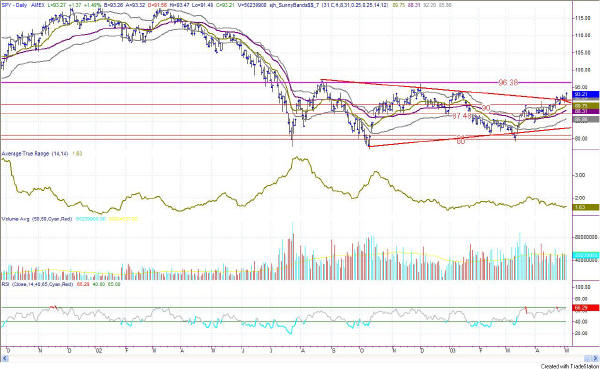
will the ES, QQQ, and INDU. I have marked 96.38 as the next Attractor on the chart of the SPYs. Actually, 93.86 will serve as the next line of resistance, as tops were evident at this line on 1/14/2003 and 9/11/2002 and bottoms presented themselves at the same level on 9/5/2002, 10/29/2002 and 12/31/2002. Since that is less than a point away, there is a high likelihood of achieving this mark before stumbling and heading back down. Until the SPY decisively breaks through the horizontal line at 96.38, as far as I am concerned we are still in a sideways market. If that turns out to be the case, then the subsequent move should be (a) down to the triangle's upsloping lower arm, which would be at about 85, or (b) even further to the bottom of the box at 79, with the 85 mark being the more likely.
While that analysis doesn't look very exciting on the daily chart, on an
intraday basis it gives us 3 points of up move to play with and then when
(and if) it reacts in correction and moves down, another shorting
opportunity of about 10 points.
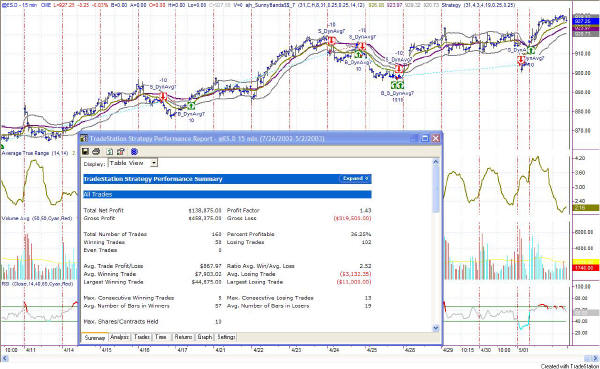
Figure 5: E-Mini 15-minute Intraday
In typical sideways market character, there have been several failed signals as the E-Mini has moved along its choppy path. Yes, it is possible to make a profit, but not for the faint of heart. As you can see from the Performance Table, a 36% accuracy rate is on the low end of the acceptable range, and one that makes most novice traders very, very edgy. In fact, it usually scares them out as they can't stomach that many losing trades. But, the goal is to make money, and if one has the discipline to stick to a mechanical system come heck or high water, it is possible to find success, even in a sideways market environment. A 36% accuracy means a 64% losing rate. But, the object of this approach is to catch pieces of trends, when they exist. In a sideways market trends are small and one must be willing to catch them quickly and get out. And, one must be willing to reverse positions on a dime, as soon as the system signals, even if it means yet another losing trade. Needless to say, it is very difficult to do, emotionally.
From the chart in Figure 5 we can see that Friday's E-Minis established a little trend upward, breaking the 3-day sideways move. I say "little" trend, because if you back out and look at the forest instead of the trees, you will see that the trend has yet
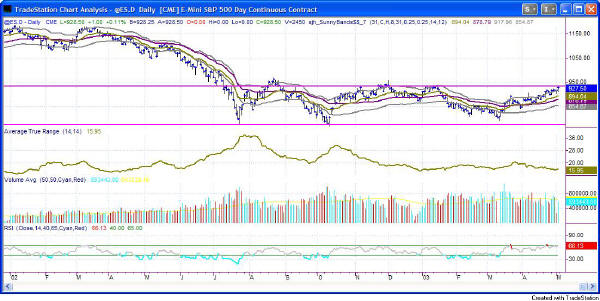
Figure 6: E-Minis Daily--"The Forest": a longer view of the little trend
to pop its head above the lengthy sideways move that has been in progress
since July 2002. And, as in the other charts, you can see that
Friday's closing was up against the overhead Attractor (Resistance) but did
not make it over it. If, next week, price go above the 930.25 level,
it could mean a run for the money, at the very least to the 966 level.
If prices weaken and turn back down (which is still the most likely
scenario), then we could be looking at a drop back to the 910 level--nearly
a 10 point short play.
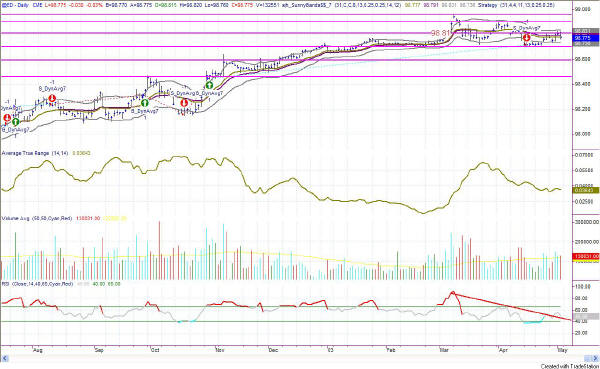
Figure 7: EuroDollar Daily
Once again, remember that currencies are long-term trending markets, not lending themselves to quick day-trading techniques. Often the trends in the currencies will take 4-6 months to develop and complete. So, this is an exercise in patience and watching grass grow. That also means that from day to day there is not a lot to say, as a commentator.
The news on the EuroDollar is still that my Sunny_DMA model is still in a
sell signal, and there is corresponding divergence in the RSI vs price,
which confirms the sell signal. In the past, the sell signals have
been short in duration, compared to the buy signals, so I'm watching the
SunnyBands closely for warnings to exit any short positions. If you don't
yet know how I trade the SunnyBands, look below in the "Rules of Thumb"
section, at rule #1. The worrisome part of this trade is that the
Sunny_DMA is moving sideways. That says to me that this sell signal is
likely to be a false signal, reversing itself in the near future. If
the ED passes up through 98.85 I would be looking to exit any short
positions. Note that I didn't say go long, just exit shorts and wait
for a long signal on the model.
I still stand by my previous commentaries watching for the markets to start a trek downwards in the near future.
Nevertheless, if any of these equity markets I report on breaks above the "yellow box" tops, it is indication to change our tune and watch for upward movement instead.
RULES OF THUMB:
1. When price is pushing the upper Sunny_Bands upward and then eases off and moves back toward the midline, it's time to take profits. If it starts moving up and pushing on the Sunny_Bands again, it's time to get back in. Likewise, if the market is pushing down on the lower Sunny_Band and eases off to move back to the midline, it's time to take profits from the short play.
2. Divergence of the RSI and price is another good time to take profits and wait for a breakout of price before taking a position.
3. When the exchange puts in curbs or trading halts on a large move down, it usually (not always) stops the downward motion. After the market reopens is a good time to take profits from your short position.
4. The market can't go nowhere forever. Eventually, who knows how long it will be, there will have to be a breakout-- one direction or the other.
==<:>==
While it may be true that a picture is worth a thousand words, it is definitely not true that a picture deserves a thousand words.
I have been asked by one of my subscribers to comment on a currency and the E-Mini, as part of this service. If any of the rest of you agree, please email me so I will know whether others want this service as well. (sunny@moneymentor.com) However, as part of including two more markets, I cannot say as many words about each chart without taking all day. I will of necessity be more to the point and succinct. Nevertheless, I will continue to point out critical Technical Analysis constructs and things that I see, and how I read them on each of the charts. I think adding the EuroDollar and the E-Mini are a good idea for some diversity.
