The Sunny Side of the Street
SUNDAY NIGHT - May 4, 2003
(Click on any chart to make it larger.)
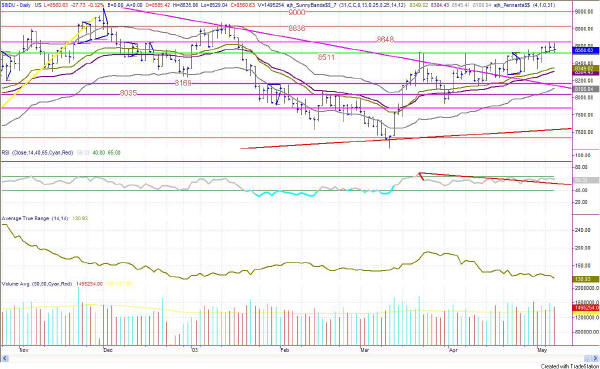
Figure 1: Daily INDU
The Dow continues to show signs of strength, having
now passed over the 8511 mark and entered into the 8648 range. My
model is still in a nice, strong buy position, but it looks like tomorrow
could take a little down turn. ATR continues to decrease and the RSI
shows a tiny bit of divergence with price. Also, countering the
current uptrend, while the highs are reaching out into higher territory, the
closes are not all at the tops of the bars.
| Subscribe now to The Sunny Side of the Street and SAVE. If you are receiving this commentary as part of the one-week trial and subscribe before the week runs out, your subscription will be only $99.95 per month, for as long as you are a continuous subscriber. If you wait, the regular subscription price is $139.95/month, which is still a great value! | |
| Consider this, how much can you lose on a single trade? How much should you pay for good advice? | |
| Like the indicators I use in this commentary? If you are a TradeStation user, you can have them on your computer, so you can follow along intraday! | |
| Need a MENTOR? Sunny is available for hourly consultation, or for extended studies. Call (888) 68-SUNNY...that's (888) 687-8669. |
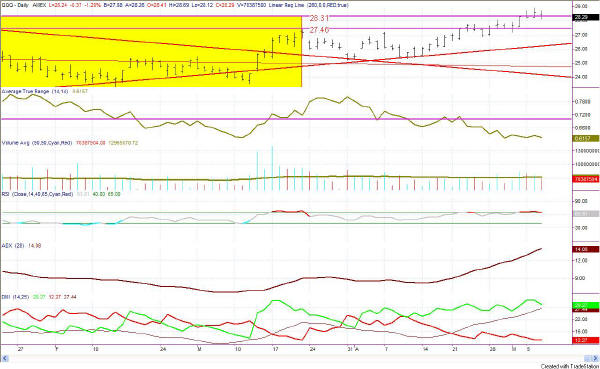
Figure 2: QQQ Daily
The QQQs passed the 28.31 mark where I said I
would change my tune on bearishness. But, only for two days.
Today the QQQs closed back under the 28.31 line. As I said, I would
not be wildly bullish until the most recent high on 12/2/2002 at 28.79 is
surpassed. While the QQQs touched that price intraday, they did not
close above it yet. Furthermore, today they seem to be heading back
downward.
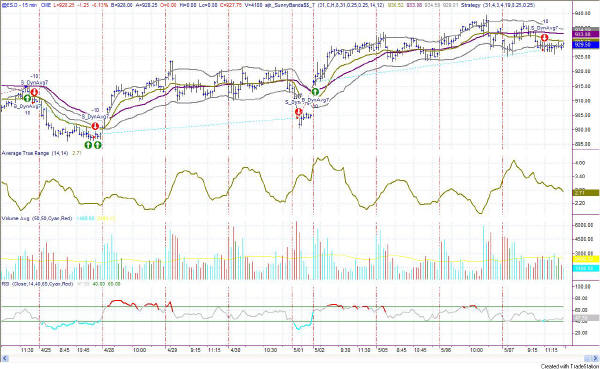
Figure 5: E-Mini 15-minute Intraday
A little more than half way through
the trading day my model gave a sell signal on the intraday E-Mini.
That signal confirms what I have been reading on the daily charts as well.
The RSI today did not show strength as it didn't even make it to the 65
level. So , we can call today's activity bullish. And, it wasn't
bearish either as it didn't take the RSI down below 40. The best we
can say it it was a day of congestion. With that information in hand,
I expect tomorrow to be a quick dip down, probably just for the single day.
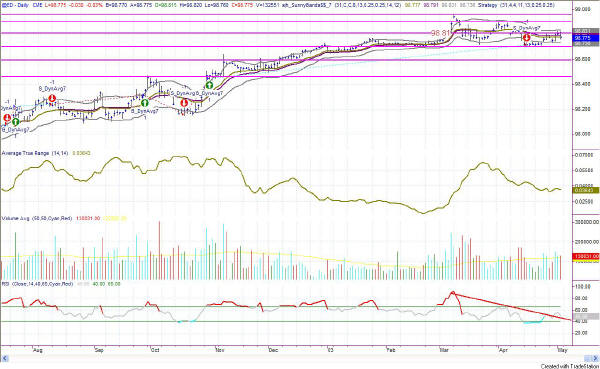
Figure 7: EuroDollar Daily
EuroDollars are a long-term play, and my
commentary on this symbol needs to be weekly at most. ED is in the
same position it was at last commentary, still acting on a sell signal on
the model.
I am now very cautiously watching the market for long plays. Since we tipped barely above the Yellow Box tops, I am alerted to potential continuing up moves. Nevertheless, I am still cautious about impending failures since the move above the yellow boxes was slight and could easily be retraced.
RULES OF THUMB:
1. When price is pushing the upper Sunny_Bands upward and then eases off and moves back toward the midline, it's time to take profits. If it starts moving up and pushing on the Sunny_Bands again, it's time to get back in. Likewise, if the market is pushing down on the lower Sunny_Band and eases off to move back to the midline, it's time to take profits from the short play.
2. Divergence of the RSI and price is another good time to take profits and wait for a breakout of price before taking a position.
3. When the exchange puts in curbs or trading halts on a large move down, it usually (not always) stops the downward motion. After the market reopens is a good time to take profits from your short position.
4. The market can't go nowhere forever. Eventually, who knows how long it will be, there will have to be a breakout-- one direction or the other.
==<:>==
While it may be true that a picture is worth a thousand words, it is definitely not true that a picture deserves a thousand words.
I have been asked by one of my subscribers to comment on a currency and the E-Mini, as part of this service. If any of the rest of you agree, please email me so I will know whether others want this service as well. (sunny@moneymentor.com) However, as part of including two more markets, I cannot say as many words about each chart without taking all day. I will of necessity be more to the point and succinct. Nevertheless, I will continue to point out critical Technical Analysis constructs and things that I see, and how I read them on each of the charts. I think adding the EuroDollar and the E-Mini are a good idea for some diversity.
