The Sunny Side of the Street
TUESDAY NIGHT - May 13, 2003
(Click on any chart to make it larger.)
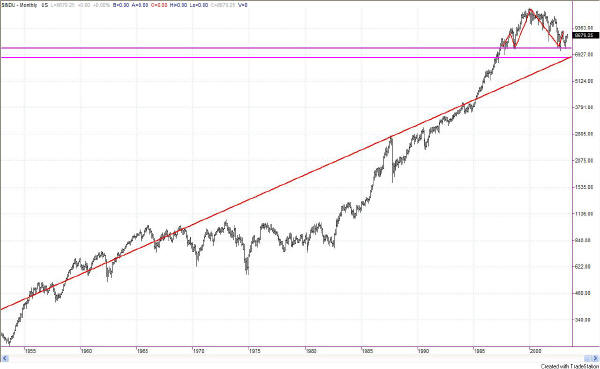
Figure 1: Monthly INDU
The precarious Head-and-Shoulders pattern continues to develop---slowly, slowly, slowly. It still (after eight months of belabored pain and sideways drugery) continues to look like this current activity could be soon followed by the next leg down on the H&S pattern.
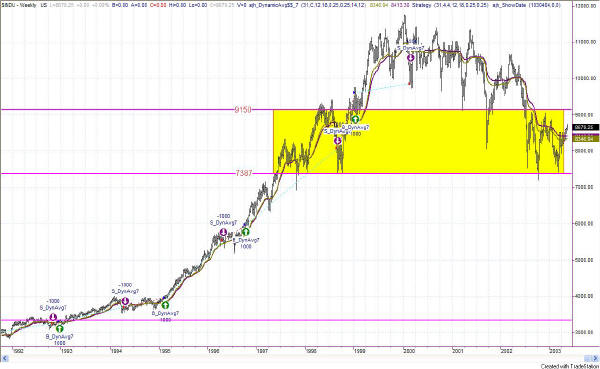
The first step of this action would be to continue rising a bit more until meeting the 9150 goal (see Figure 2) which would be accomplished by short squeezes. Then, after all the shorts are out, and there are no buyers yet ready to take the plunge, would begin the leg down which could go as low as 7387 before it even begins to violate the pattern.
Note in Figure 2 that the Dow is still in sideways congestion on a weekly basis, still within the yellow box, and still forming the H&S pattern.
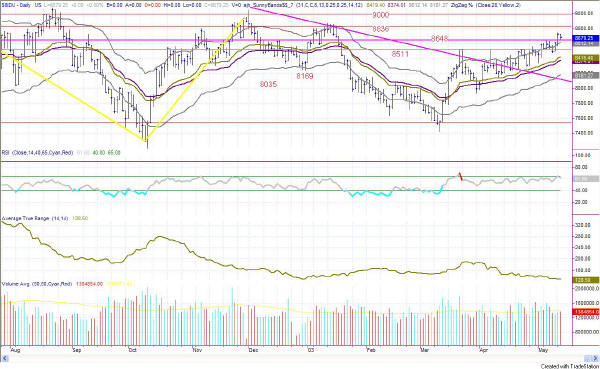
The daily chart of the Dow (in Figure 3) shows what would appear to be a confidently rising market were it not for Figures 1 and 2 above. Note, however, that in Figure 3 we are seeing narrowed ATRs and diminishing volume as the market rises, suggesting hesitation by buyers, or outright short covering, in the process.
Nevertheless, price is still in the upper Sunny_Band and the SDMA is still in Buy position. So, until the market tells us otherwise, the word is still Long.
| Subscribe now to The Sunny Side of the Street and SAVE. If you are receiving this commentary as part of the one-week trial and subscribe before the week runs out, your subscription will be only $99.95 per month, for as long as you are a continuous subscriber. If you wait, the regular subscription price is $139.95/month, which is still a great value! | |
| Consider this, how much can you lose on a single trade? How much should you pay for good advice? | |
| Like the indicators I use in this commentary? If you are a TradeStation user, you can have them on your computer, so you can follow along intraday! | |
| Need a MENTOR? Sunny is available for hourly consultation, or for extended studies. Call (888) 68-SUNNY...that's (888) 687-8669. |
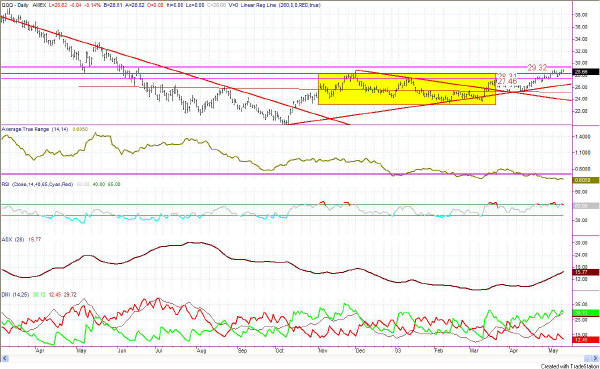
Figure 4: QQQ Daily
Today looks like a down day on the Daily chart, even though it really is a sideways day on the intraday chart. The 29.32 mark has not been met. The high of today was 28.99, still 33 cents away from the level that is acting as heavy resistance.
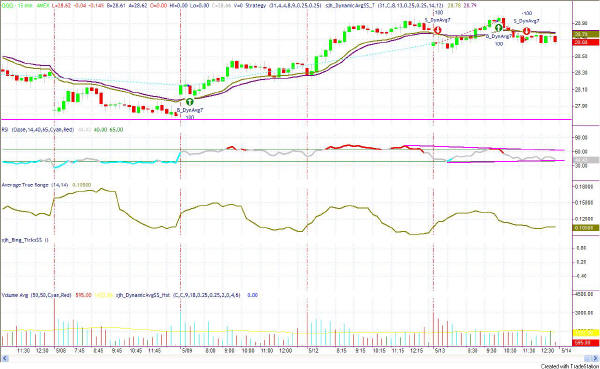
Note in Figure 5 that the model gave 3 conflicting signals today, verifying that it was one of those horrible choppy, sideways days. All three signals came at about the same level, too. However, the astute trader (and chart interpreter) would hav avoided all three because volume was under the average, and RSI is in divergence with price.
Of interest is the double divergence of RSI and price. RSI is, in fact, in congestion itself! A sideways day with RSI disagreeing with itself. This just says that even the indicators can't tell which way the market wants to go.
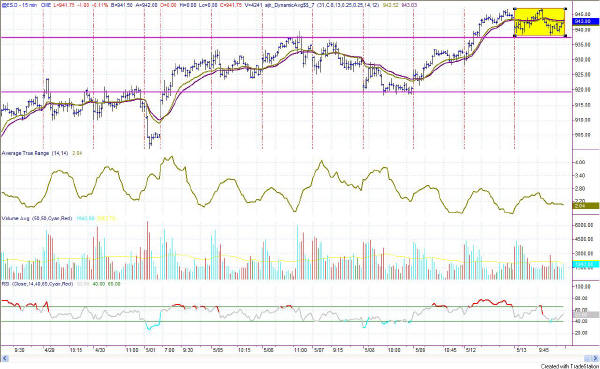
Figure 6: E-Mini 15-min Intraday
Figure 6 shows the intraday E-mini going impossibly sideways, just like the other markets we analyze. On this market, however, the model strategy stayed short all day, which is the most likely position at the moment.
Now is a good time to be short or out of the market, unless the E-Mini goes above 947.04 (the top of the yellow box).
Since the H&S pattern is an often failed pattern, the pattern evident on the monthly and weekly charts could become null and void at any time. In other words, if asked for a stock tip at the moment, I would say "stay out."
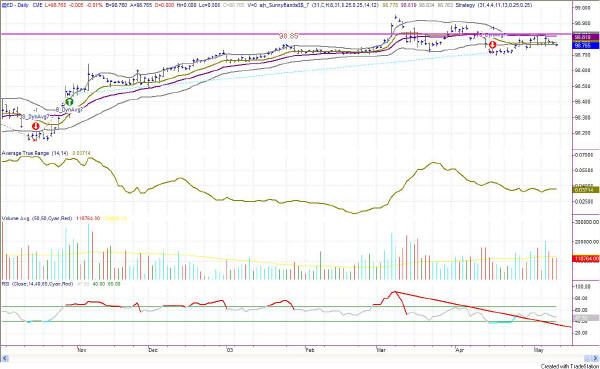
Figure 7: EuroDollar Daily - Sunday night commentary only
EuroDollar is
now beginning to show some reaction to the sell signal of a few weeks ago.
The formation looks like a rounded top now, with an impending down move.
Stay patient. Unless it goes up, it's going down.
I am now very cautiously watching the market for long plays. Since we tipped barely above the Yellow Box tops, I am alerted to potential continuing up moves. Nevertheless, I am still cautious about impending failures since the move above the yellow boxes was slight and could easily be retraced.
RULES OF THUMB:
1. When price is pushing the upper Sunny_Bands upward and then eases off and moves back toward the midline, it's time to take profits. If it starts moving up and pushing on the Sunny_Bands again, it's time to get back in. Likewise, if the market is pushing down on the lower Sunny_Band and eases off to move back to the midline, it's time to take profits from the short play.
2. Divergence of the RSI and price is another good time to take profits and wait for a breakout of price before taking a position.
3. When the exchange puts in curbs or trading halts on a large move down, it usually (not always) stops the downward motion. After the market reopens is a good time to take profits from your short position.
4. The market can't go nowhere forever. Eventually, who knows how long it will be, there will have to be a breakout-- one direction or the other.
==<:>==
While it may be true that a picture is worth a thousand words, it is definitely not true that a picture deserves a thousand words.
