The Sunny Side of the Street
MONDAY
NIGHT - May 19, 2003
View Archives by
Clicking Here
Weekend Stock Picks --
CLICK HERE
(Click on any chart to make it larger.)
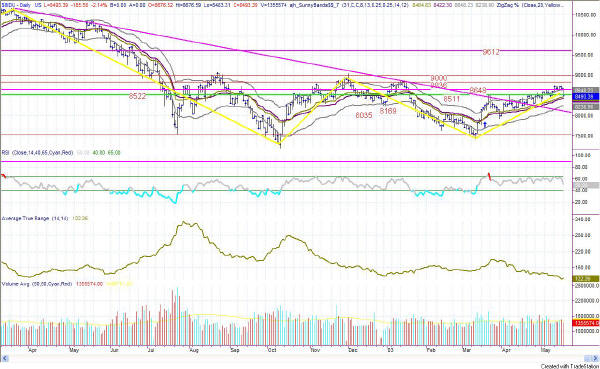
Figure 1: Daily Dow
At last, a little clue. In last night's commentary I said:
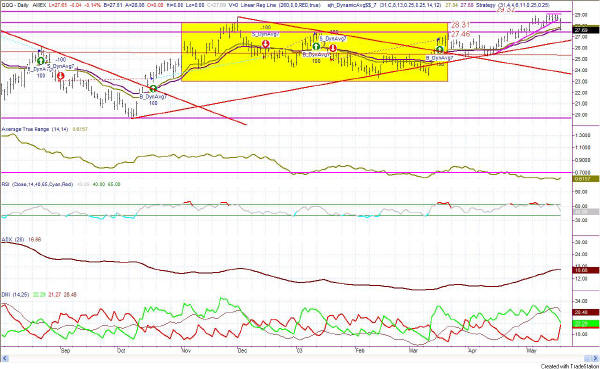
- "We now have our fifth day wherein the QQQ could not make it above the bar I have drawn at the 29.12 level. That is not a very strong showing for the markets."
The Dow was down today by 185 points in average volume. The Average True Range is now down to 122 points per day, so that move weights in at above ATR for the day. It also puts the daily Dow bar right back on the midline of the Sunny_Bands. Now, for a closer look. In Figure 2, the intraday chart, you can see
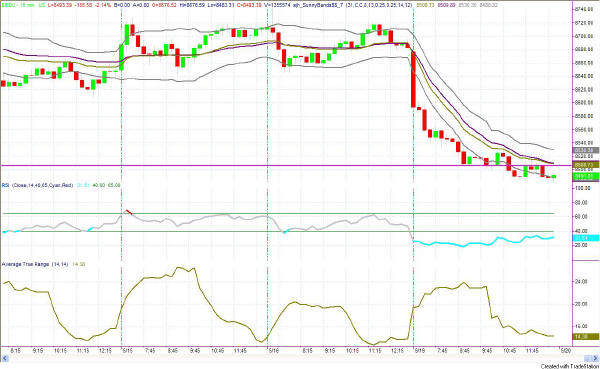
Figure 2: Intraday 15-minute INDU
that the 15-minute activity went immediately below the Sunny_Bands - a very strong sign - and stayed there for most of the day. As long as price stayed below the bands it was safe to stay short.
On the Daily chart (Figure 1) according to the rules of thumb below, because the daily bar hit the Sunny_Bands midline it would be time to take profits on the long trade.
On the Intraday chart of the INDU in Figure 2, the Sunny_Dynamic_Moving_Average crossed over into a sell signal on the last bar of yesterday, putting the model into sell mode. This morning was the reward. When prices started moving back up into the bands, the rule of thumb says to take profits when price touches the midline of the Sunny_Bands, which it did ot do yet. Even though the price action started looking like it was forming a bottom, without touching the band, it tends to stay strong in the current direction.
On the 15-minute chart, however, you can see RSI beginning to create a positive divergence with price, which could signal an eminent change of direction.
| Consider this, how much can you lose on a single trade? How much should you pay for good advice? If you could make $1,000 per month trading advice that cost you $139.95 per month, would it be worth it? That's 7:1 odds! | |
| Subscribe now to The Sunny Side of the Street and SAVE. If you are receiving this commentary as part of the one-week trial and subscribe before the week runs out, your subscription will be only $99.95 per month, for as long as you are a continuous subscriber. If you wait, the regular subscription price is $139.95/month, which is still a great value! | |
| Like the indicators I use in this commentary? If you are a TradeStation user, you can have them on your computer, so you can follow along intraday! | |
| Need a MENTOR? Sunny is available for hourly consultation, or for extended studies. Call (888) 68-SUNNY...that's (888) 687-8669. | |
| How about help using or programming TradeStation? Give us a call. It's what I enjoy the most. |
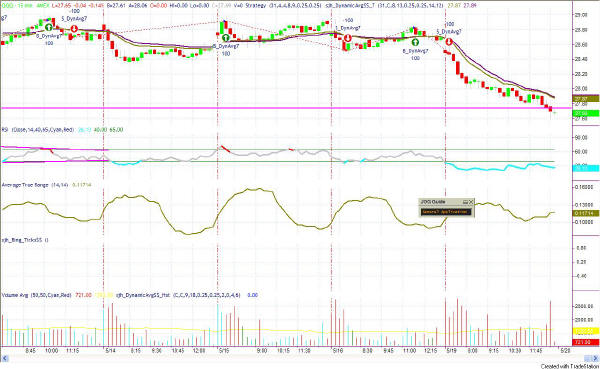
Figure 3: QQQ Intraday 15-minute
The QQQ model went into sell mode on the second bar of the morning trading session, and continued steadily downward for the remainder of the day, ending on a down note. That usually means more downward activity for tomorrow. The price on the QQQ went right to, and just a little bit beyond the Attractor I had set long ago at 27.74. The last time price neared this Attractor it bounced straight back up, but there was positive RSI divergence on the chart at the time.
On the daily chart of the QQQ, price is now back inside the Yellow Box, which could easily mean that it will continue on downward to the 25.60 level. So after 5 days of trying to go higher without any success, and a down day today that wasn't much larger than an ATR, I'm going to say we are more likely to have a down day again tomorrow than an up day.
Happy trading, and be very cautious.
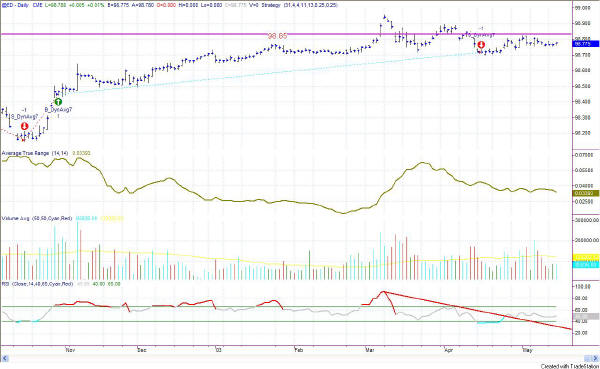
Figure 4: EuroDollar Daily - Sunday night commentary only
EuroDollar is
still on a sell signal, barely budging since last week. It looks like
it could go on up a little further before going down in response to the
signal, but currencies set up trends and take a long time to develop.
So, let's keep watching.
RULES OF THUMB:
1. When price is pushing the upper Sunny_Bands upward and then eases off and moves back toward the midline, it's time to take profits. If it starts moving up and pushing on the Sunny_Bands again, it's time to get back in. Likewise, if the market is pushing down on the lower Sunny_Band and eases off to move back to the midline, it's time to take profits from the short play.
2. Divergence of the RSI and price is another good time to take profits and wait for a breakout of price before taking a position.
3. When the exchange puts in curbs or trading halts on a large move down, it usually (not always) stops the downward motion. After the market reopens is a good time to take profits from your short position.
4. The market can't go nowhere forever. Eventually, who knows how long it will be, there will have to be a breakout-- one direction or the other.
==<:>==
While it may be true that a picture is worth a thousand words, it is definitely not true that a picture deserves a thousand words.
