The Sunny Side of the Street
TUESDAY
NIGHT - May 20, 2003
View Archives by
Clicking Here
Weekend Stock Picks --
CLICK HERE
(Click on any chart to make it larger.)
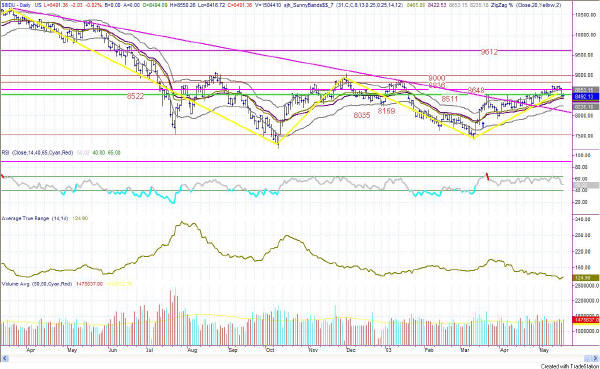
Figure 1: Daily Dow
In last night's commentary I said:
- "So after 5 days of trying to go higher without any success, and a down day today that wasn't much larger than an ATR, I'm going to say we are more likely to have a down day again tomorrow than an up day."
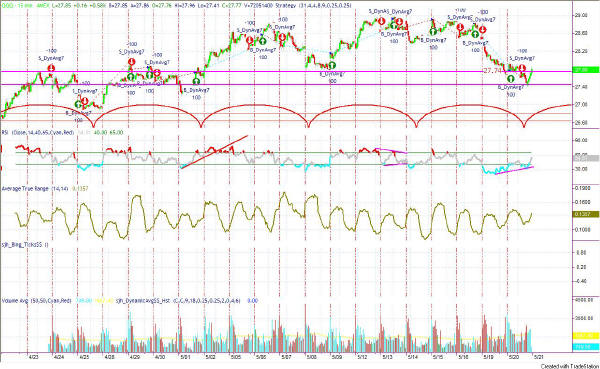
And, that's just what happened today. Another down day. I suppose you could argue the point on today's activity, since the intraday activity (Figure 2) looks pretty sharply down at one point, but the open and the close of the day were almost at the same place. So, if you just read the daily numbers, it wasn't much of an anything day; but, from the chart in Figure 2 you can see that the market had some considerable downward pressure at one point.

Figure 2: Intraday 15-minute INDU
Today's intraday RSI stayed in the midrange for most of the day, neither bullish nor bearish. That is probably a positive sign, but we will see as we combine all the technicals together.
| Consider this, how much can you lose on a single trade? How much should you pay for good advice? If you could make $1,000 per month trading advice that cost you $139.95 per month, would it be worth it? That's 7:1 odds! | |
| Subscribe now to The Sunny Side of the Street and SAVE. If you are receiving this commentary as part of the one-week trial and subscribe before the week runs out, your subscription will be only $99.95 per month, for as long as you are a continuous subscriber. If you wait, the regular subscription price is $139.95/month, which is still a great value! | |
| Like the indicators I use in this commentary? If you are a TradeStation user, you can have them on your computer, so you can follow along intraday! | |
| Need a MENTOR? Sunny is available for hourly consultation, or for extended studies. Call (888) 68-SUNNY...that's (888) 687-8669. | |
| How about help using or programming TradeStation? Give us a call. It's what I enjoy the most. |
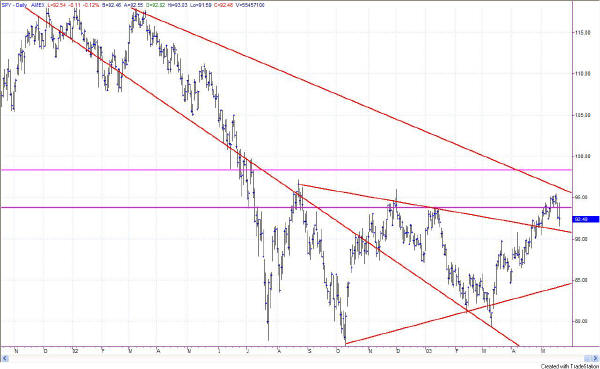
Figure 3: SPY Daily Chart
The SPY is nearing an important trendline, from a support standpoint. This Attractor, drawn in Figure 3 above, will probably take the SPY on down just a little bit further and then make 3-5 days of "noise" as the trendline is re-tested. Look for some squiggly lines on top of that trendline for the next few days.
It is of interest that the SPY didn't make it up as high as the descending trendline above the recent highs, before heading down these past two days. I would have been a little more confident in the bullishness if the market had made it up to that Attractor first.
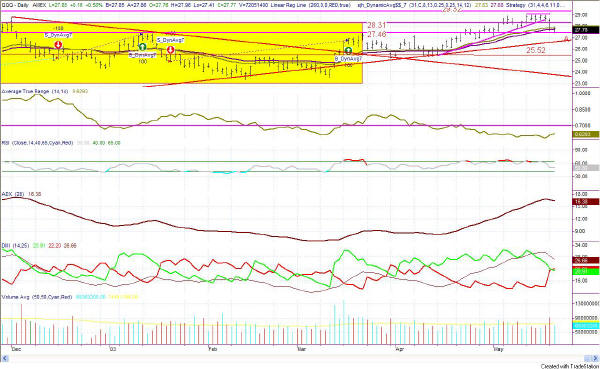
Figure 4: QQQ Daily
The lower exploration by the QQQ intraday took us further into the Yellow Box, and closer to the trendline Attractor I have labeled A in Figure 4. Last week I said that the QQQs lack of ability to rise above the 29.32 line was cause to take profits and wait. The buy signal is overextended and it is too soon for a daily sell signal. If the QQQ breaks the trendline labeled A, then we can expect it to drop onward to the 25.52 line before a bounce. Early birds might consider the scalping risk worth it. But, I am unsure whether to read this as a pause before a bounce, or the beginning of a new correction. I am leaning toward the correction interpretation, however, especially since the RSI is still in divergence with price, and needs to go just a bit further down.
The intraday reading of the QQQ is what has me on edge about reading the daily chart. The RSI on the intraday chart is in positive divergence with price, indicating an impending up move, while the daily chart seems to be calling for further downside activity.
Perhaps the confusion is just going to result in more sideways action for a few days, because it doesn't appear to be anything real definitive.
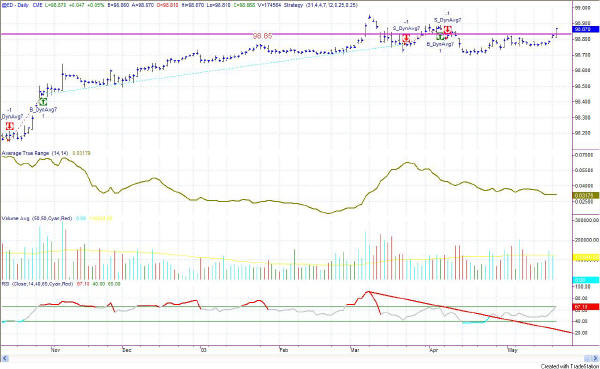
Figure 4: EuroDollar Daily - Sunday night commentary only
Today's strong
upward move on ED rose above the Attractor at 98.85, thus closing any short
positions. Now is time to sit on the sidelines and wait & watch.
Happy trading, and be very cautious.
RULES OF THUMB:
1. When price is pushing the upper Sunny_Bands upward and then eases off and moves back toward the midline, it's time to take profits. If it starts moving up and pushing on the Sunny_Bands again, it's time to get back in. Likewise, if the market is pushing down on the lower Sunny_Band and eases off to move back to the midline, it's time to take profits from the short play.
2. Divergence of the RSI and price is another good time to take profits and wait for a breakout of price before taking a position.
3. When the exchange puts in curbs or trading halts on a large move down, it usually (not always) stops the downward motion. After the market reopens is a good time to take profits from your short position.
4. The market can't go nowhere forever. Eventually, who knows how long it will be, there will have to be a breakout-- one direction or the other.
==<:>==
While it may be true that a picture is worth a thousand words, it is definitely not true that a picture deserves a thousand words.
