The Sunny Side of the Street
THURSDAY
NIGHT - May 22, 2003
View Archives by
Clicking Here
Weekend Stock Picks --
CLICK HERE
(Click on any chart to make it larger.)
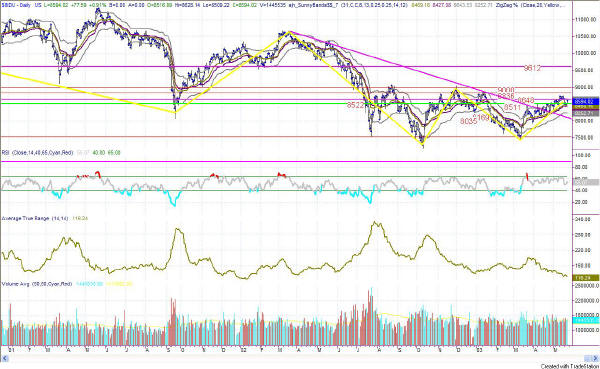
Figure 1: Daily Dow
In last night's commentary I said:
- "[Yesterday'] sort of narrow day often produces a large move day following, and that's what I expect for tomorrow. Can't say whether it will be up or down, but it should move sharply."
And, that's just what happened today. In a rapid upswing first thing in the morning, the Dow moved up over 100 points before settling down and leaving 78 of those points to show for the close. On a day when the Average True Range shows an expected range for the day of 116 points, that's a pretty good day!
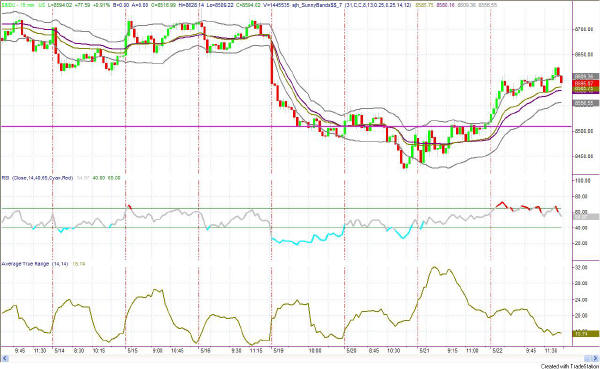
Figure 2: Intraday 15-minute INDU
Today's intraday RSI stayed, for the most part, at or above the 65 line, showing strength in this move. To me that speaks to more upward motion for tomorrow. It makes sense logically that the day before a holiday would show buying for the weekend and short-covering, both of which would take the market up.
| Consider this, how much can you lose on a single trade? How much should you pay for good advice? If you could make $1,000 per month trading advice that cost you $139.95 per month, would it be worth it? That's 7:1 odds! | |
| Subscribe now to The Sunny Side of the Street and SAVE. If you are receiving this commentary as part of the one-week trial and subscribe before the week runs out, your subscription will be only $99.95 per month, for as long as you are a continuous subscriber. If you wait, the regular subscription price is $139.95/month, which is still a great value! | |
| Like the indicators I use in this commentary? If you are a TradeStation user, you can have them on your computer, so you can follow along intraday! | |
| Need a MENTOR? Sunny is available for hourly consultation, or for extended studies. Call (888) 68-SUNNY...that's (888) 687-8669. | |
| How about help using or programming TradeStation? Give us a call. It's what I enjoy the most. |
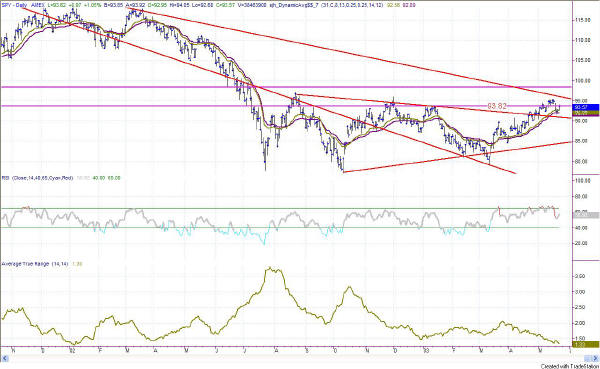
Figure 3: SPY Daily Chart
The SPY, along with the QQQs and the Dow, made a quick jump up this morning, just to the horizontal line drawn at 93.82. More than likely the move was in response to Greenspan's testimony. Nevertheless, it didn't really go above the line, which is a bit disheartening. Overall, the formation still looks like it could take a tumble back to the downsloping trendline, and beyond for a Fibonacci size correction in the near future.
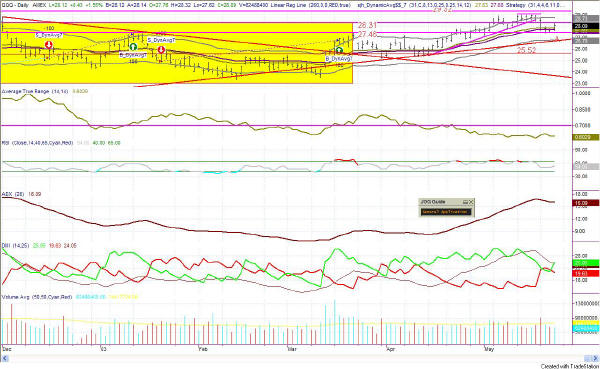
Figure 4: QQQ Daily
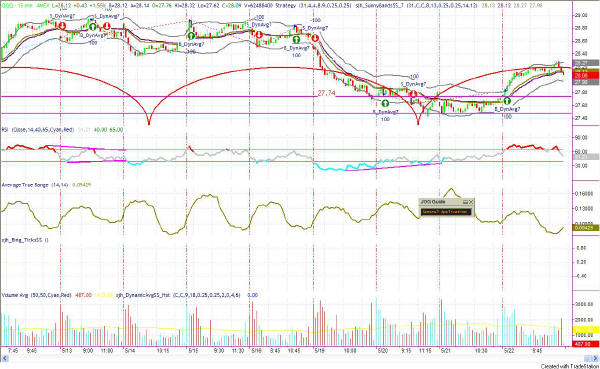
Today's QQQ move went right up to the top line of the Yellow Box, without going over. Now, the question of importance--what will it do tomorrow? Will the QQQ pass through the overhead resistance? Or will it be reflected back down again to spend some more time in the horizontal movement of the Yellow Box channel?
The cycle drawn in Figure 5 predicted today's run up nicely, and is now nearing its crest. It probably can support one more upday before beginning to exert downward pressure, however, so watch for that.
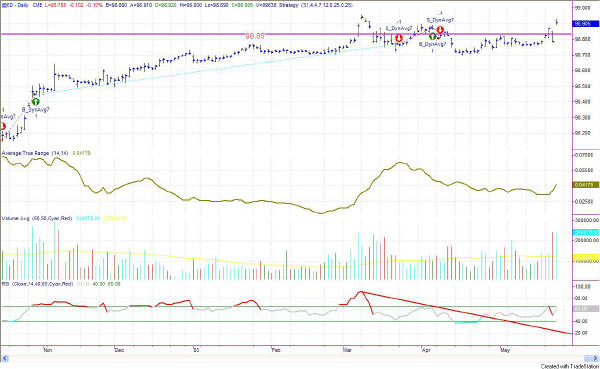
Figure 4: EuroDollar Daily - Sunday night commentary only
Tuesday's strong upward move on ED rose above the Attractor at 98.85, thus closing any short positions. Now is time to sit on the sidelines and wait & watch.
Thursday's even stronger move upward on a gap confirms the exiting of the
short position and our current stance in wait and watch mode.
Happy trading, and be very cautious. Say your prayers of thanks each day, and ask for understanding.
RULES OF THUMB:
1. When price is pushing the upper Sunny_Bands upward and then eases off and moves back toward the midline, it's time to take profits. If it starts moving up and pushing on the Sunny_Bands again, it's time to get back in. Likewise, if the market is pushing down on the lower Sunny_Band and eases off to move back to the midline, it's time to take profits from the short play.
2. Divergence of the RSI and price is another good time to take profits and wait for a breakout of price before taking a position.
3. When the exchange puts in curbs or trading halts on a large move down, it usually (not always) stops the downward motion. After the market reopens is a good time to take profits from your short position.
4. The market can't go nowhere forever. Eventually, who knows how long it will be, there will have to be a breakout-- one direction or the other.
==<:>==
While it may be true that a picture is worth a thousand words, it is definitely not true that a picture deserves a thousand words.
