
The Sunny Side of the Street
TUESDAY
NIGHT - May 27, 2003
Archives of Past
Commentaries . How Did We Do?
Weekend Stock Picks --
CLICK HERE
(Click on any chart to make it larger.)
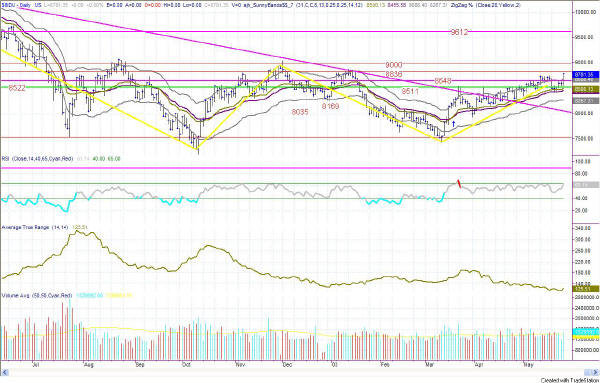
Figure 1: Daily Dow
In last night's commentary I said:
- "The short stance is most likely to prevail as the cycle spends the next two days going downward. The ever-lessening ATR speaks to a big move in the making, and I believe it will be a down move because of the cycle and because of the weakening RSI. "
Boy, was I wrong on that one!
My market model gave a buy signal on the QQQ chart 3 bars (45 minutes) after the down opening. The RSI rolled over and gave up any signs of weakening and turned right back into bullish territory. Nevertheless, the ATR still drifts downward, and none of the markets (that I watch) made it past the next line of resistance. All of the markets were drawn upward toward the Attractors (resistance), but they just couldn't get over the line.
The Attractors are as follows:
| Market | Attractor (Resistance) | Today's Close |
| INDU | 8836 | 8781 |
| QQQ | 29.32 | 29.10 |
| SPY | 96.38 | 95.40 |
| E-Mini | 958.6 | 932.25 |
So, I'm not running away from my stand. It still looks to me like the market's bullish move is topping out (in the short term) and needs at least a 1/3 correction. A correction like that would put the Dow back down around 8500 or so. Of course, it is not going to happen in one day (although it could). More likely is a wave 4 sideways, choppy correction. Such a corrective action would keep the flavor of the past and would still look to the casual observer as if the market were going to continue in the channel of the past two years.
But, be wary! If that type correction does occur, then comes the 5th wave! And, it should take the Dow on up to 9612.
| Consider this, how much can you lose on a single trade? How much should you pay for good advice? If you could make $1,000 per month trading advice that cost you $139.95 per month, would it be worth it? That's 7:1 odds! | |
| Subscribe now to The Sunny Side of the Street and SAVE. If you are receiving this commentary as part of the one-week trial and subscribe before the week runs out, your subscription will be only $99.95 per month, for as long as you are a continuous subscriber. If you wait, the regular subscription price is $139.95/month, which is still a great value! | |
| Like the indicators I use in this commentary? If you are a TradeStation user, you can have them on your computer, so you can follow along intraday! | |
| Need a MENTOR? Sunny is available for hourly consultation, or for extended studies. Call (888) 68-SUNNY...that's (888) 687-8669. | |
| How about help using or programming TradeStation? Give us a call. It's what I enjoy the most. |
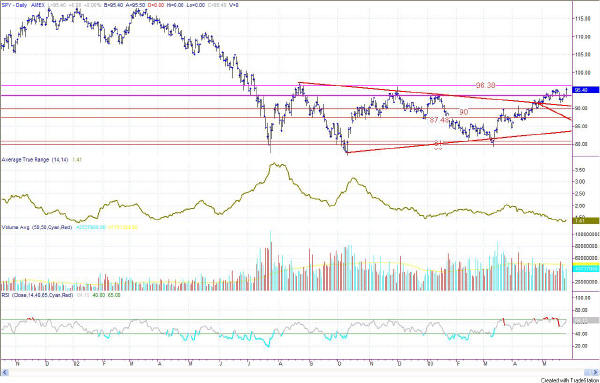
Figure 2: Daily SPY
The SPY did just as the others did today: it dropped on the open, in response to overnight trading activity, and then proceeded to spend the remainder of the day climbing sharply.
Tonight's after-hours activity is sideways from today's close, on low volume. Basically, the after-hours market action doesn't tell us much.
What is interesting, however, is that the RSI is in bearish divergence with price, and is also overbought. That, along with declining volume on the SPY daily chart lead me to believe that a correction is imminent.
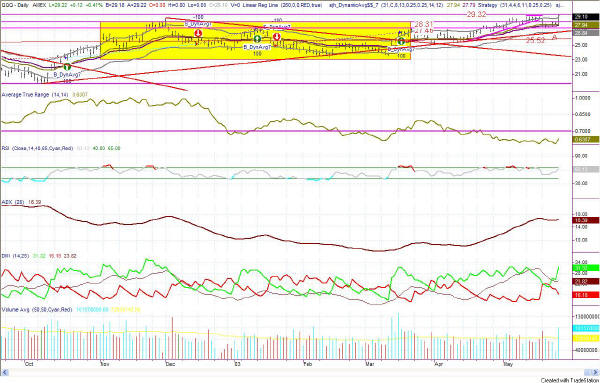
Figure 3: QQQ Daily
We are out of the Yellow Box again!
This morning was in the box, this afternoon was out of the box. However, price highs did not make it past the critical Attractor looming large overhead at 29.32. Today's close at 29.10 did make it past the 5 highs of last week sitting at the 28.99 level. So, that's positive news for the QQQ. And, if it turns out to be positive for the next day's QQQ action, it will be positive for the other markets as well.
With today's large up-day the ADX turned slightly upward, showing a resumption of the uptrend, with +DMI greater than -DMI. Yet, ATR is still very low and the RSI is in slight divergence with price. So, it could go either way.
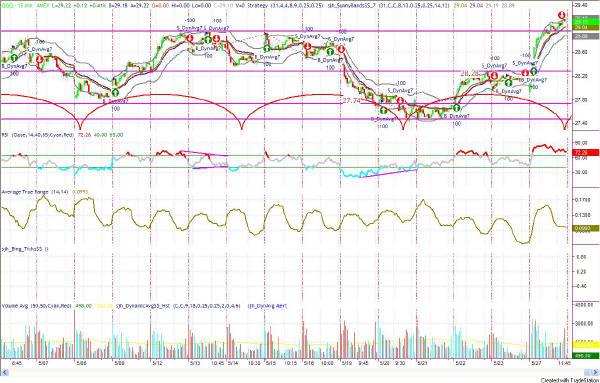
Figure 4: QQQ Intraday 15-minute bars
Right at the top of today my SDMA model gave a sell signal on the 15-minute QQQ chart. It was probably a good place to take profits, but not necessarily a shorting opportunity, just yet.
On the intraday chart, today's activity looks like a 3-wave. If so, that could mean the 4th wave would be a fairly sharp correction, as the 2-wave was sideways. Usually if the 2-wave is sideways or in a congestive formation, the 4-wave will be sharply down (and vice-versa).
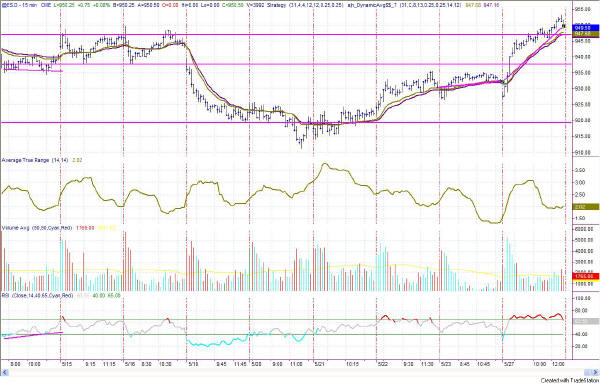
Figure 5: ES intraday 15-minute bars
The E-Mini intraday chart stayed long on the SDMA model all day, and did not give a sell signal at the high of the day, as did the QQQ model. Furthermore, the RSI is strong (though a bit on the overbought side), and is not in divergence. These signals are conflicting with the analysis of the Dow and QQQ.
Still, the E-Mini has not gone above the Attractor at 958.6, and it will have to do that before I become convinced we are resuming the bullish move.
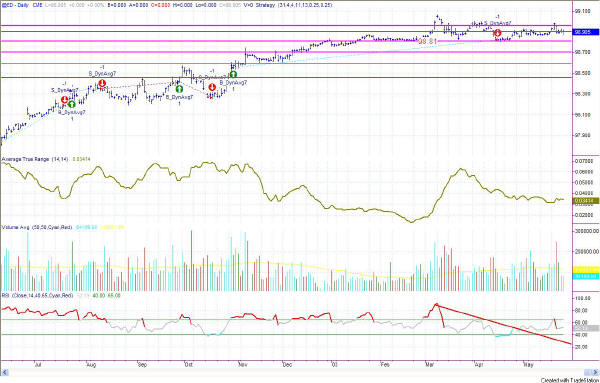
Figure 6: EuroDollar Daily - Sunday night commentary only
We are still in
wait and watch mode on the Eurodollar. The short signal is still in
place, but until prices drop below the magenta horizontal line at 98.85 I am
still watching. The Sunny_Dynamic_Moving_Average (SDMA) is still in
the sell configuration, with the purple line on top of the gold line, but
you can see in Figure 6 that the two lines are now almost coincident.
That could easily turn to a buy signal in the near future. If it does,
I will still be in wait and watch mode unless the ED breaks above 98.98.
The bulk of the evidence weighs heavily on the side of expecting a correction, but nevertheless being in place to go long at a moment's notice. So, be sharp and on your toes.
RULES OF THUMB:
1. When price is pushing the upper Sunny_Bands upward and then eases off and moves back toward the midline, it's time to take profits. If it starts moving up and pushing on the Sunny_Bands again, it's time to get back in. Likewise, if the market is pushing down on the lower Sunny_Band and eases off to move back to the midline, it's time to take profits from the short play.
2. Divergence of the RSI and price is another good time to take profits and wait for a breakout of price before taking a position.
3. When the exchange puts in curbs or trading halts on a large move down, it usually (not always) stops the downward motion. After the market reopens is a good time to take profits from your short position.
4. The market can't go nowhere forever. Eventually, who knows how long it will be, there will have to be a breakout-- one direction or the other.
==<:>==
While it may be true that a picture is worth a thousand words, it is definitely not true that a picture deserves a thousand words.