The Sunny Side of the Street
MONDAY
NIGHT - June 2, 2003
Archives of Past
Commentaries . How Did We Do?
Weekend Stock Picks --
CLICK HERE
(Click on any chart to make it larger.)
Figure 1a: COMPARISON: DOW vs SPY vs NASDAQ
In last night's commentary I said:
- "This should take several weeks to form, and will only be negated
by a move above 8836 on a closing basis on the daily chart."
- And, today's close is above the 8836 level.
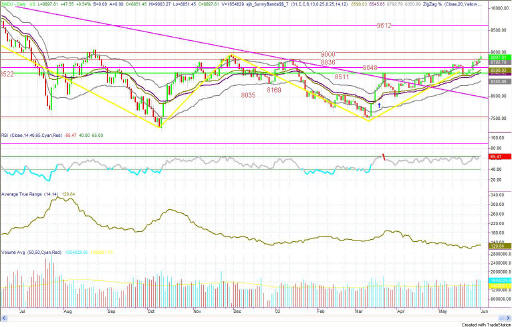
The Dow today crossed the magic line and stayed there. That's important. I am almost willing to abandon my position of looking for a correction and join the bullish camp, but not quite. There is still one more hurdle before I believe that we will be in the 3rd wave and going convincingly on upward once again making a play for the 10,000 level. And, that hurdle is to break above the 9000 even number level and hold above it on a closing basis.
You can easily see that the 9000 level, on the daily chart in Figure 1b, was tested back in December 2002 and August 2002, both times unsuccessfully. Then in January 2003 the Dow couldn't make it over the 8836 level successfully, and we kept on going down. Because of the inertia factor, we still have a higher likelihood of turning back down and continuing to play in the 7500 to 9000 range for another year or more, than of running upward in a brand new bull market.
The Average True Range is still continuing to make new lows and show that everyone is afraid to take a stand. The point spread from day to day is just getting more and more narrow. And, RSI hasn't really made it out of the neutral zone by getting above 65, and playing in the really bullish range.
So, I am still skeptical, even though I seem to be alone in this stance.
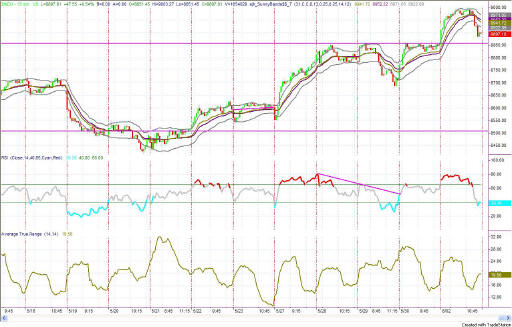
Figure 1c: INDU 15 minute bars
On the intraday Dow chart you can see that just as the Dow hit the 9000 level, it skidded right off and dropped quickly, knocking 103 points off the gain--either in profit taking or sheer fear. That is another sign that keeps me thinking we still have some correction to come before the market runs on up much further.
As the prices on the Dow snuck back into the middle of the Sunny_Bands was the time to take your profits and bail out of the long play, if you were in it.
If you are reading this commentary and don't have your copy of Sunny_Bands, it is time to consider getting this indicator for TradeStation, so that you can follow along on the intraday charts and refine your trading to this level.
Now that price is under the Sunny_Bands, and the SDMA has crossed giving a sell signal, it should probably finish the drop to the Attractor line at 8857 tomorrow, and then take a little bounce off of that line.
| Consider this, how much can you lose on a single trade? How much should you pay for good advice? If you could make $1,000 per month trading advice that cost you $139.95 per month, would it be worth it? That's 7:1 odds! | |
| Subscribe now to The Sunny Side of the Street and SAVE. If you are receiving this commentary as part of the one-week trial and subscribe before the week runs out, your subscription will be only $99.95 per month, for as long as you are a continuous subscriber. If you wait, the regular subscription price is $139.95/month, which is still a great value! | |
| Like the indicators I use in this commentary? If you are a TradeStation user, you can have them on your computer, so you can follow along intraday! | |
| Need a MENTOR? Sunny is available for hourly consultation, or for extended studies. Call (888) 68-SUNNY...that's (888) 687-8669. | |
| How about help using or programming TradeStation? Give us a call. It's what I enjoy the most. |
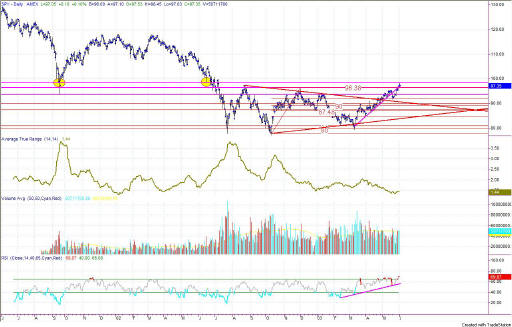
Figure 2a: SPY Daily
In last night's commentary I said:
- "...if it continues on upward on Monday, it would be a good time to consider going long."
Well, that day has come.
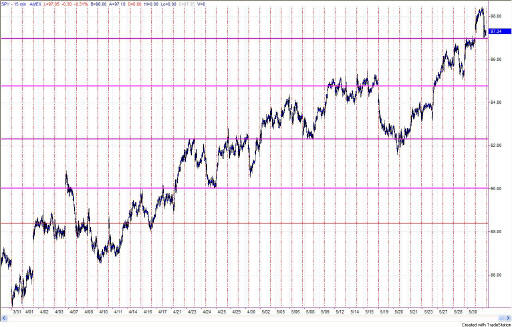
Figure 2b: SPY 15-minute Intraday
The SPY intraday chart makes some
3-point swings evident from a Support and Resistance standpoint, as the
market makes its way up and then retraces that ground, but nevertheless
climbing at about a 45 degree angle as it climbs. If that pattern
continues, it lends further support to my theory of an impending
correction, probably back down at least 3 points on the SPY to the 95
level.
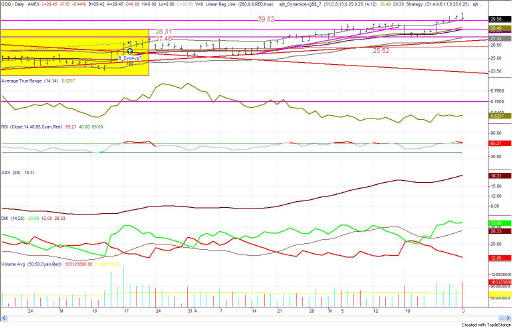
Figure 3a: QQQ Daily
The QQQ is still out of the Yellow Box, but not by much. And, today's bar was heading in that correction, with the candlestick formation showing the open higher than the close.
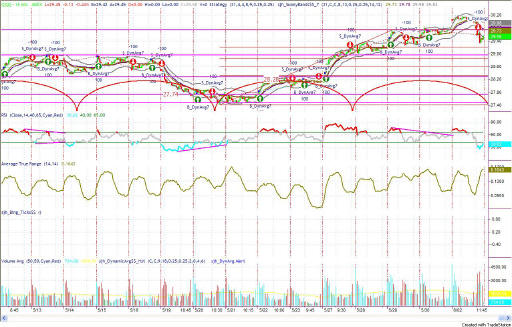
Figure 3b: QQQ Intraday 15-minute bars
Prices on the Intraday QQQ are now outside of the Sunny_Bands, to the downside, and the SDMA has crossed into a sell signal on the model. Further, the cycle has neared the end of its swing and should be starting up again in the next few days. But, first I still think it needs to finish the correction down to at least the Fibonacci 23.6% retracement level, which would put the QQQs at 29.19.
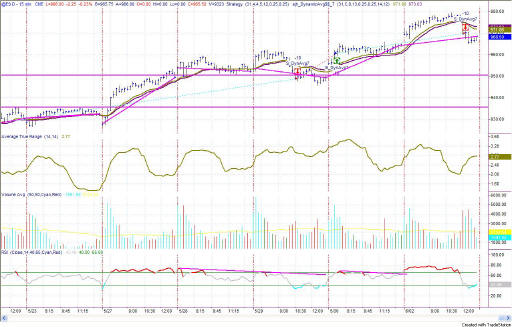
Figure 4a: EMini 15-minute Intraday
The E-Mini is on the same schedule as the SPY, the Dow and the QQQs (should I say "as always"?) The shape of today was the same on all of them, even if the ending numbers were unique to the instrument.
On the E-Mini, the Attractor looks to be at 964.86, which is right where today's low went. That level is the same as the highs of the day before. So, the most likely event for tomorrow would be to retest the Attractor and either find strength from which to bounce upward, or weakness and drop like a rock to the 950 level.
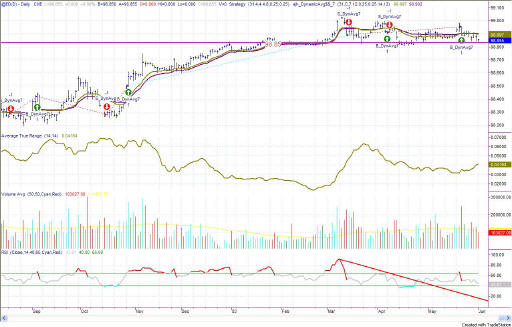
Figure 5a: EuroDollar Daily - Sunday night commentary only
The
EuroDollar is now in a buy signal on the model. However, the prices
are underneath the Sunny_Dynamic_Moving_Averages. To me that is a
negative sign, which would keep me from going long just yet. With the
SDMA at 99, only a close above that would tell me to go long. Further,
the RSI is in negative divergence, and that would have to be resolved before
I would consider taking a long position.
The bulk of the evidence weighs heavily on the side of expecting a correction, but nevertheless being in place to go long at a moment's notice. So, be sharp and on your toes.
RULES OF THUMB:
1. When price is pushing the upper Sunny_Bands upward and then eases off and moves back toward the midline, it's time to take profits. If it starts moving up and pushing on the Sunny_Bands again, it's time to get back in. Likewise, if the market is pushing down on the lower Sunny_Band and eases off to move back to the midline, it's time to take profits from the short play.
2. Divergence of the RSI and price is another good time to take profits and wait for a breakout of price before taking a position.
3. When the exchange puts in curbs or trading halts on a large move down, it usually (not always) stops the downward motion. After the market reopens is a good time to take profits from your short position.
4. The market can't go nowhere forever. Eventually, who knows how long it will be, there will have to be a breakout-- one direction or the other.
==<:>==
While it may be true that a picture is worth a thousand words, it is definitely not true that a picture deserves a thousand words.
