The Sunny Side of the Street
THURSDAY
NIGHT - June 5, 2003
Archives of Past
Commentaries . How Did We Do?
Weekend Stock Picks --
CLICK HERE
(Click on any chart to make it larger.)
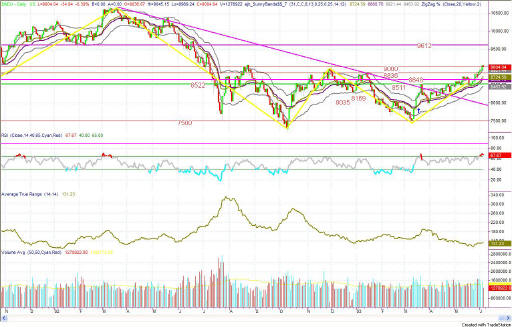
Figure 1a: COMPARISON: DOW vs SPY vs NASDAQ (Intraday)
In last night's commentary I said:
- "And, now I am finally willing to take on long positions on the daily
chart. We have now made a new 10-month high. If tomorrow
breaks 9134, we will have a new 11-month high."
| Consider this, how much can you lose on a single trade? How much should you pay for good advice? If you could make $1,000 per month trading advice that cost you $139.95 per month, would it be worth it? That's 7:1 odds! | |
| Subscribe now to The Sunny Side of the Street and SAVE. If you are receiving this commentary as part of the one-week trial and subscribe before the week runs out, your subscription will be only $99.95 per month, for as long as you are a continuous subscriber. If you wait, the regular subscription price is $139.95/month, which is still a great value! | |
| Like the indicators I use in this commentary? If you are a TradeStation user, you can have them on your computer, so you can follow along intraday! | |
| Need a MENTOR? Sunny is available for hourly consultation, or for extended studies. Call (888) 68-SUNNY...that's (888) 687-8669. | |
| How about help using or programming TradeStation? Give us a call. It's what I enjoy the most. |
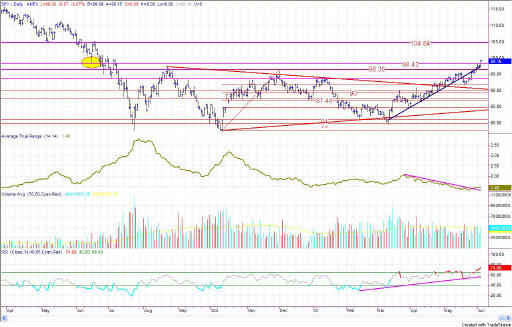
Figure 2a: SPY Daily
Today's SPY bar also made it out and over the remaining hurdle, closing above 98.42 resistance, at 99.16. By my Elliott Wave calculator, the 3rd wave should go to 101.51 or beyond. If this upthrust is now the case, and we add the length of the previous run to the date for the bottom of the 2nd wave, that would take us to about June 23 for the topping. In order for that to happen, we need some "irrational exuberance" to come into the markets now.

Figure 2b: SPY 15-minute Intraday
The intraday 15-minute chart paints a little bit different picture from the daily chart. On the intraday chart you can see divergence in the day session's price vs RSI, which continues into the night session. This could mean a bit of a down day for tomorrow, casting doubts about todays crossings.
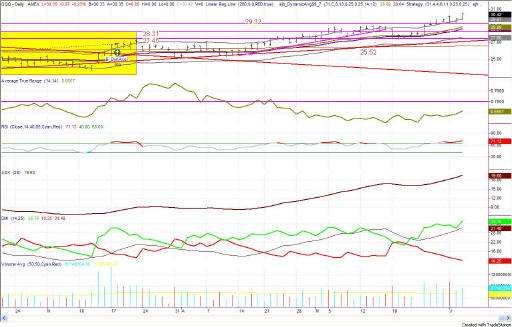
Figure 3a: QQQ Daily
The QQQ is still out of the Yellow Box, but not by much. The low of the QQQs today touched the 29.32 Attractor, re-testing that level.
The bar for today is pointing upward, but I am still very cautious about impending trends. Is this part of a sideways sliding correction, or is it about to rise again?
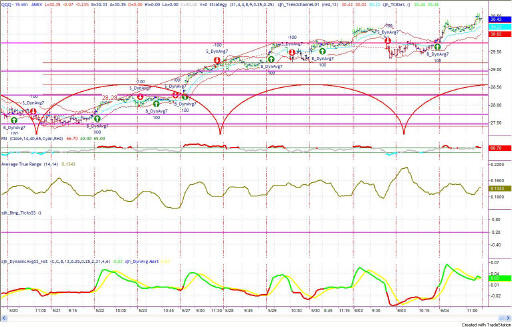
Figure 3b: QQQ Intraday 15-minute bars
Intraday prices move fairly smoothly today, up and over the buy signa that came in last night, with a resting spot, but no back tracing. That's a good steady picture for things to come, foretelling strength in future moves. In the QQQ as well as the INDU and SPY, I expect followthrough as the market moves on upward toward the 34 line overhead.

Figure 4a: EMini Daily
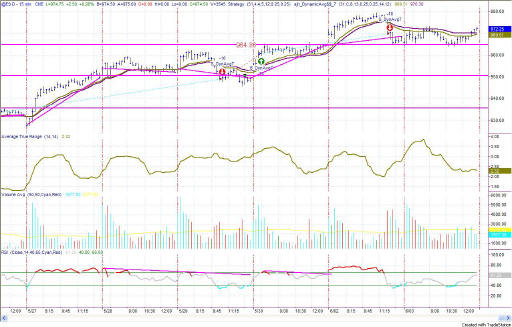
Figure 4b: EMini intraday 15 min bars
The Attractor at 24.42 was met with resistance on 5/28 at 959, and is now well above it. There was again resistance at 949.78.
This type of activity is likely to continue forward for some time to come. That would bring on the 4rd wave peak-out as the hat touches to one last topping processes.
Stay on your toes. It could just as easily go either way, although I am still leaning towards calling for a correction.
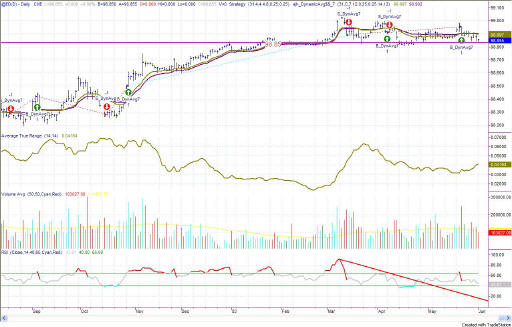
Figure 5a: EuroDollar Daily - Sunday night commentary only
The
EuroDollar is now in a buy signal on the model. However, the prices
are underneath the Sunny_Dynamic_Moving_Averages. To me that is a
negative sign, which would keep me from going long just yet. With the
SDMA at 99, only a close above that would tell me to go long. Further,
the RSI is in negative divergence, and that would have to be resolved before
I would consider taking a long position.
The bulk of the evidence weighs heavily on the side of expecting a correction, but nevertheless being in place to go long at a moment's notice. So, be sharp and on your toes.
RULES OF THUMB:
1. When price is pushing the upper Sunny_Bands upward and then eases off and moves back toward the midline, it's time to take profits. If it starts moving up and pushing on the Sunny_Bands again, it's time to get back in. Likewise, if the market is pushing down on the lower Sunny_Band and eases off to move back to the midline, it's time to take profits from the short play.
2. Divergence of the RSI and price is another good time to take profits and wait for a breakout of price before taking a position.
3. When the exchange puts in curbs or trading halts on a large move down, it usually (not always) stops the downward motion. After the market reopens is a good time to take profits from your short position.
4. The market can't go nowhere forever. Eventually, who knows how long it will be, there will have to be a breakout-- one direction or the other.
==<:>==
While it may be true that a picture is worth a thousand words, it is definitely not true that a picture deserves a thousand words.
