The Sunny Side of the Street
SUNDAY
NIGHT - June 8, 2003
Archives of Past
Commentaries . How Did We Do?
Weekend Stock Picks --
CLICK HERE
(Click on any chart to make it larger.)
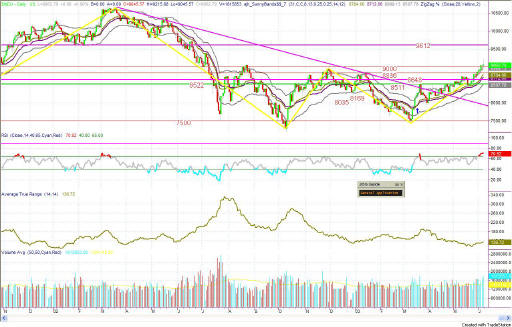
Figure 1a: COMPARISON: DOW vs SPY vs NASDAQ (Intraday)
In last time's commentary I said:
- "On the intraday chart you can see divergence in the day session's
price vs RSI, which
continues into the night session. This could mean a bit of a down day
for tomorrow, casting doubts about today's crossings."
-
- And, Friday started out as an up day, but finished off with a plunge back down below the previous day's close.
- The Dow's close at 9062 keeps it above the upper Sunny_Band, and above 9000 showing strength.
- BUT, the formation of a Shooting Star on Friday's bar is cause for concern, as this is a bearish formation.
| Consider this, how much can you lose on a single trade? How much should you pay for good advice? If you could make $1,000 per month trading advice that cost you $139.95 per month, would it be worth it? That's 7:1 odds! | |
| Subscribe now to The Sunny Side of the Street and SAVE. If you are receiving this commentary as part of the one-week trial and subscribe before the week runs out, your subscription will be only $99.95 per month, for as long as you are a continuous subscriber. If you wait, the regular subscription price is $139.95/month, which is still a great value! | |
| Like the indicators I use in this commentary? If you are a TradeStation user, you can have them on your computer, so you can follow along intraday! | |
| Need a MENTOR? Sunny is available for hourly consultation, or for extended studies. Call (888) 68-SUNNY...that's (888) 687-8669. | |
| How about help using or programming TradeStation? Give us a call. It's what I enjoy the most. |
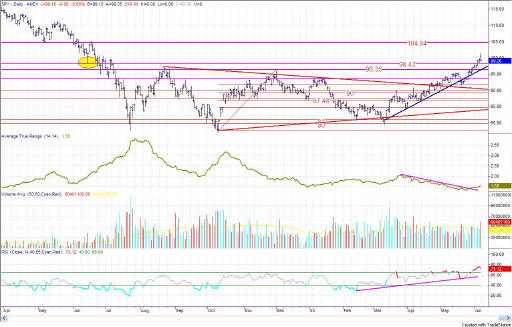
Figure 2a: SPY Daily
Friday's action does not negate my Thursday commentary that the SPY bar also made it out and over the remaining hurdle, closing above 98.42 resistance, at 99.16. By my Elliott Wave calculator, the 3rd wave should go to 101.51 or beyond. If this upthrust is now the case, and we add the length of the previous run to the date for the bottom of the 2nd wave, that would take us to about June 23 for the topping. In order for that to happen, we need some "irrational exuberance" to come into the markets now.
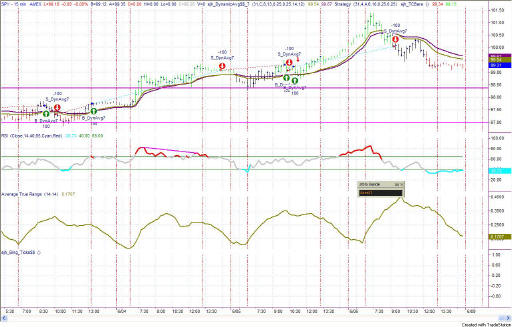
Figure 2b: SPY 15-minute Intraday
The intraday chart paints a picture that votes for touching 98.38 before bouncing back upward.
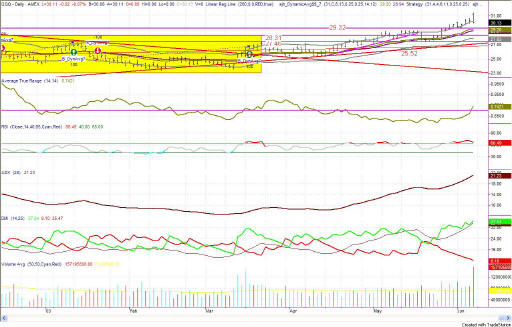
Figure 3a: QQQ Daily
The QQQ is still soundly out of the Yellow Box and continuing to run on up. The next upper Attractor is at 33.79, which would take us back to support found in February of 2002, more than a year ago.
On the weekly chart, 33.79 also looks like the next line of importance on the upside, so let's begin watching long positions for profit taking at that level.
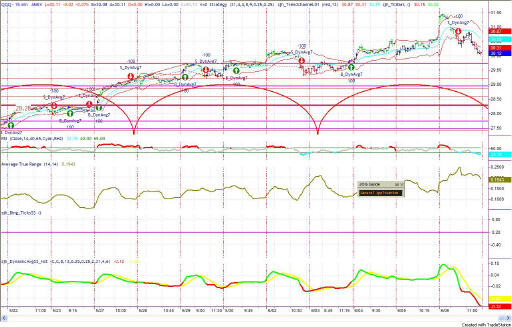
Figure 3b: QQQ Intraday 15-minute bars
On the intraday chart, the cycle makes a case for one more day of downside action before bouncing back upward. So, with this cycle in mind, don't hold onto short positions for long, unless they continue to fall rapidly and continue churning out the profits. If the Shooting Star evident on the daily charts becomes the dominant pattern, then all the markets will take a tumble back towards 29.32.
A good case can be made for reaching the 29.32 level, as the Sunny_DMA (Dynamic Moving Average) is lying right about at that level and the closing price on QQQ is now inside the Sunny_Bands upper line.
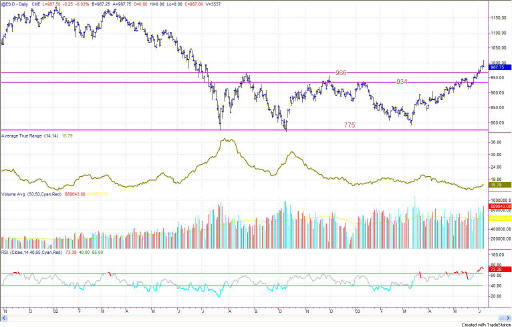
Figure 4a: EMini Daily
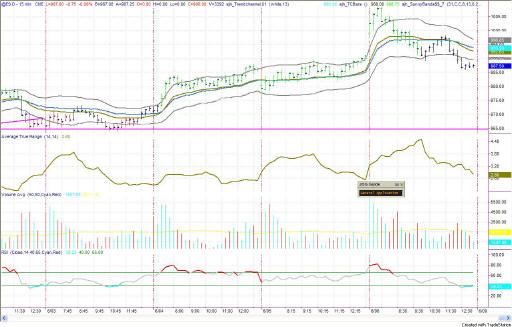
Figure 4b: EMini intraday 15 min bars
The Emini met the resistance at 1000 by slamming through it, but falling back downward to form a Shooting Star on the daily chart.
According to most Candlestick Analysts, a Shooting Star is a bearish reversal pattern. It occurs in an upper trend which indicates that the market opens at the lows of the session, rallies and pulls back to the bottom. We recognize this pattern with it's very long upper shadow, a small real body at the lower end of the price range and usually the real body gaps away from the prior real body.
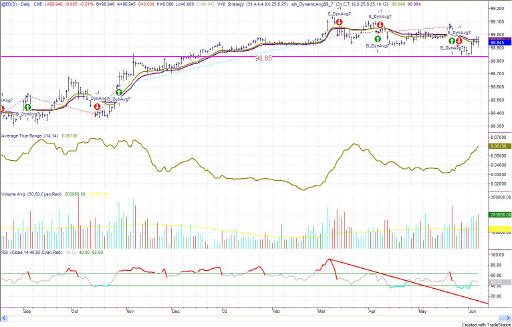
Figure 5a: EuroDollar Daily - Sunday night commentary only
Don't you just hate it when markets get into those choppy sideways periods? There is nothing much you can do but wait for a trend to emerge.
The
current signal on the EuroDollar is short, with current closing prices still
under the Sunny_DMA lines. So, short it shall be until the market
tells us otherwise.
The bulk of the evidence weighs heavily on the side of expecting a correction, but nevertheless being in place to go long at a moment's notice. So, be sharp and on your toes.
RULES OF THUMB:
1. When price is pushing the upper Sunny_Bands upward and then eases off and moves back toward the midline, it's time to take profits. If it starts moving up and pushing on the Sunny_Bands again, it's time to get back in. Likewise, if the market is pushing down on the lower Sunny_Band and eases off to move back to the midline, it's time to take profits from the short play.
2. Divergence of the RSI and price is another good time to take profits and wait for a breakout of price before taking a position.
3. When the exchange puts in curbs or trading halts on a large move down, it usually (not always) stops the downward motion. After the market reopens is a good time to take profits from your short position.
4. The market can't go nowhere forever. Eventually, who knows how long it will be, there will have to be a breakout-- one direction or the other.
==<:>==
While it may be true that a picture is worth a thousand words, it is definitely not true that a picture deserves a thousand words.
