The Sunny Side of the Street
MONDAY
NIGHT - June 9, 2003
Archives of Past
Commentaries . How Did We Do?
Weekend Stock Picks --
CLICK HERE
(Click on any chart to make it larger.)
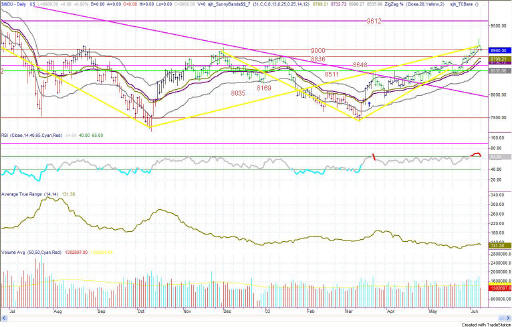
Figure 1a: COMPARISON: DOW vs SPY vs NASDAQ (Intraday)
In last time's commentary I said:
- "On the intraday chart, the cycle makes a case for one more day of downside action before bouncing back upward. "
And, today's action proved out that supposition, giving us one more down day in the markets, with the Dow moving from 9061 down to 8980.
Notice, in Figure 1 above, that I am working on a paintbar indicator to be used with the Sunny_Bands. (It will be called Sunny_Bands_Pro (SBPro)). As long as the prices are above the midline of the SDMA, the bars will be painted green; when prices are below the midline, the bars will be painted red; and when prices are vacillating back and forth across the midline, they will be painted black. Notice what an outstanding job this indicator does of pointing out some pretty ideal trades.
At this time the SBPro lines are all green, indicating that it is still a good time to be long on the daily chart. However, today's bar from a candlestick interpretation was a solid bar (or red if you are using colors) indicating that the movement for the day was downward.
If you are interested in Candlestick analysis,
and want to know more. in a quick overview style, visit my website
www.moneymentor.com, click on
Index, click on T for Technical Analysis, and then click on Candlesticks.
There you can find patterns and their interpretations. Keep in mind
that this is a work in progress, and visit here often.
| Consider this, how much can you lose on a single trade? How much should you pay for good advice? If you could make $1,000 per month trading advice that cost you $139.95 per month, would it be worth it? That's 7:1 odds! | |
| Subscribe now to The Sunny Side of the Street and SAVE. If you are receiving this commentary as part of the one-week trial and subscribe before the week runs out, your subscription will be only $99.95 per month, for as long as you are a continuous subscriber. If you wait, the regular subscription price is $139.95/month, which is still a great value! | |
| Like the indicators I use in this commentary? If you are a TradeStation user, you can have them on your computer, so you can follow along intraday! | |
| Need a MENTOR? Sunny is available for hourly consultation, or for extended studies. Call (888) 68-SUNNY...that's (888) 687-8669. | |
| How about help using or programming TradeStation? Give us a call. It's what I enjoy the most. |
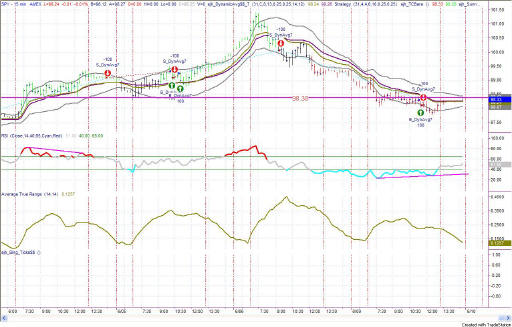
Figure 2a: SPY Intraday 15-minute
Today's follow through to yesterday's reversal pattern took the SPY down to the Attractor looming at 98.38, where it spent most of the day cycling back and forth over the line. It was a good solid sell signal, with the SBPro lines staying red for the entire day, meaning that price stayed under the SDMA midline for the entire trading session. Tonight's market is doing nothing to negate that, and is still red, and under the midlines.
Because the SBPro lines were red, we would have ignored the buy signal given by the model and simply held onto the short position dictated by the signal given on 6/6/03 at 9:30PT.
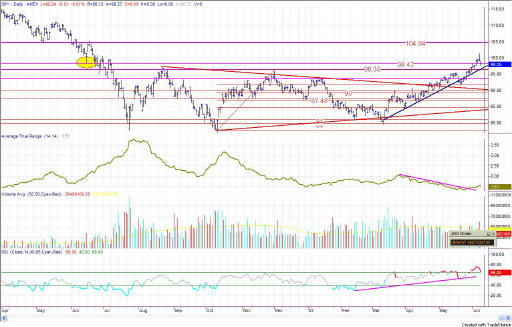
The daily picture (Figure 2b) left yesterday's bar in an island top configuration, calling for further moves to the downside. Practically speaking, the next logical stopping place is at the trendline that has been supporting the up move since 3/12/2003, and that point is just about at the 98.42 Attractor. That is the point at which I would expect a bounce in the next few days.
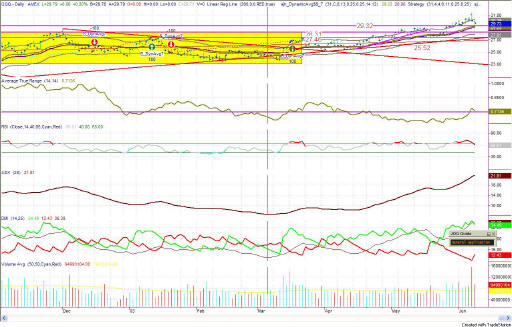
Figure 3a: QQQ Daily
While the QQQ is still outside the Yellow Box, it is heading back towards it. My guess is that the top of the box will be the bouncing point where the QQQs take off again on their way upward. Today's daily bar almost touched the Attractor at 29.32, by getting as low as 29.53. The top of the Yellow Box is at 28.31, so it is a little further down before the bounce happens, but not much. Beware and keep your powder dry.
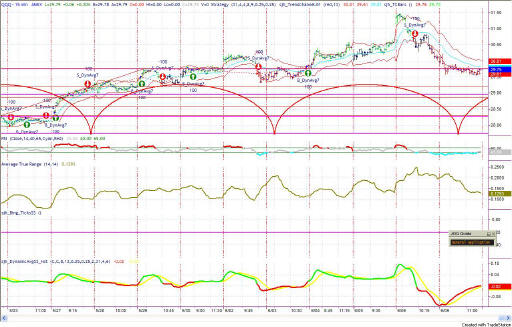
Figure 3b: QQQ Intraday 15-minute bars
The cycle on the intraday chart (Figure 3b) is now moving upward again, calling for the intraday price action to start upward soon. But, giving a little leeway for cycles sliding back and forth in time, it could still support the theory of moving down just a little bit more.
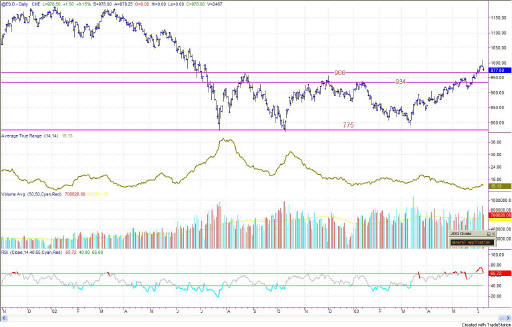
Figure 4a: EMini Daily
Like the other markets we study, the EMini pulled back today, reacting to the Shooting Star reversal pattern of Friday. It, like the others, dropped almost to the Attractor at 966, leaving a little more room for tomorrow to put in some more downside action, before a bounce.
The ATR is beginning to expand, and so is volume. Both of these mean to me that Mom and Pop are coming back into the markets, slowly and we can start some of the irrational exuberance in the near future.
RSI is still well into overbought territory, where it can stay for long periods of time. Over the next few days RSI should bounce back and forth between 50 and 90, showing strength in the face of the potential move downward.
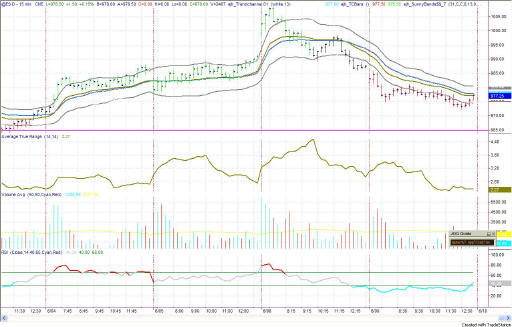
Figure 4b: EMini intraday 15 min bars
The EMini stayed red all day on the SBPro indicator, showing that it was under the midline for the duration. However, the last bar of the day touched the midline, but did not make it all the way over (with open, high, low and close being above the line). ATR is diminishing, showing that Mom and Pop are nervous about the upcoming potential change in direction, and are playing this one close to the vest.
Nevertheless, the model is in a sell signal, which cannot be ignored. And if you are an intraday trade watcher, this is the position I prefer until we get a black bar on the SBPro or until the color changes to green, showing a full change of direction. As long as it is red, we stay with the short position.
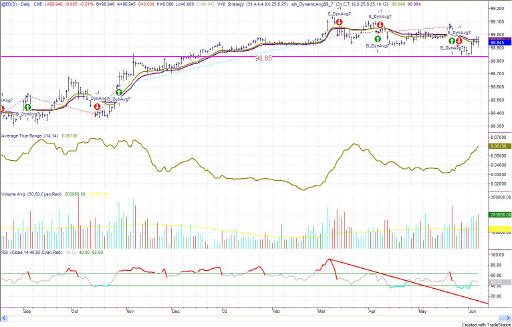
Figure 5a: EuroDollar Daily - Sunday night commentary only
Don't you just hate it when markets get into those choppy sideways periods? There is nothing much you can do but wait for a trend to emerge.
The
current signal on the EuroDollar is short, with current closing prices still
under the Sunny_DMA lines. So, short it shall be until the market
tells us otherwise.
The bulk of the evidence weighs heavily on the side of expecting a correction, but nevertheless being in place to go long at a moment's notice. So, be sharp and on your toes.
RULES OF THUMB:
1. When price is pushing the upper Sunny_Bands upward and then eases off and moves back toward the midline, it's time to take profits. If it starts moving up and pushing on the Sunny_Bands again, it's time to get back in. Likewise, if the market is pushing down on the lower Sunny_Band and eases off to move back to the midline, it's time to take profits from the short play.
2. Divergence of the RSI and price is another good time to take profits and wait for a breakout of price before taking a position.
3. When the exchange puts in curbs or trading halts on a large move down, it usually (not always) stops the downward motion. After the market reopens is a good time to take profits from your short position.
4. The market can't go nowhere forever. Eventually, who knows how long it will be, there will have to be a breakout-- one direction or the other.
==<:>==
While it may be true that a picture is worth a thousand words, it is definitely not true that a picture deserves a thousand words.
