The Sunny Side of the Street
THURSDAY
NIGHT - June 19, 2003
Archives of Past
Commentaries . How Did We Do?
Weekend Stock Picks --
CLICK HERE
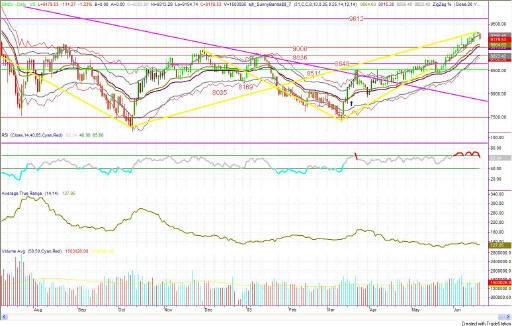
Figure 1a: COMPARISON: DOW vs SPY vs NASDAQ (Intraday)
In last time's commentary I said:
- "The fact remains, that the ending pattern of today's daily bar is now a doji candlestick, which usually means a big move tomorrow. In fact, it usually means a reversal day for tomorrow.."
Today's market action did the customary reaction to a doji bar, and reversed from the previous action.
The Dow opened at 9293 and moved steadily down to 9178 over the course of the day. I don't see it as much of a corrective action, and you can see that the daily bars remain touching the top Sunny_Band level. According to that indicator my model stays long for the long term. Only after the price bars touch the midline band will it be a signal for me to exit longs.
| Consider this, how much can you lose on a single trade? How much should you pay for good advice? If you could make $1,000 per month trading advice that cost you $139.95 per month, would it be worth it? That's 7:1 odds! | |
| Subscribe now to The Sunny Side of the Street and SAVE. If you are receiving this commentary as part of the one-week trial and subscribe before the week runs out, your subscription will be only $99.95 per month, for as long as you are a continuous subscriber. If you wait, the regular subscription price is $139.95/month, which is still a great value! | |
| Like the indicators I use in this commentary? If you are a TradeStation user, you can have them on your computer, so you can follow along intraday! | |
| Need a MENTOR? Sunny is available for hourly consultation, or for extended studies. Call (888) 68-SUNNY...that's (888) 687-8669. | |
| How about help using or programming TradeStation? Give us a call. It's what I enjoy the most. |
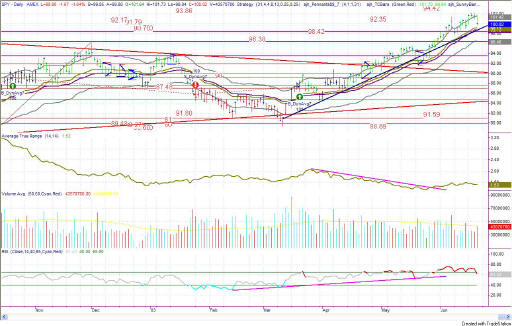
Figure 2a: SPY Daily
The SPY moved a bit more sharply down on the daily chart, heading for the supportive trendline moving upward since March. It would not surprise me for the SPY to complete the move down to the bar and then bounce upward from there.
Another reason to confirm that expectation is that on the SPY the RSI is in divergence with price. But, it is still positive news that the RSI did not penetrate its upsloping trendline.
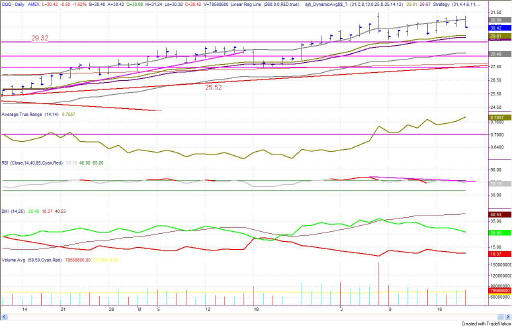
Figure 3a: QQQ Daily
The QQQ is in the same configuration as the SPY, with the RSI in slight divergence with price. Average True Range is moving up, which could mean a fast move down, if it happens, because the range would be wider.
The ADX is moving upward, demonstrating a trending market, and the +DMI is on top of the -DMI, showing us that the trend is upward. Obviously, we can observe that pretty easily by ourselves with no indicators--so what good is the indicator? Its benefit comes when the market loses its steam. At that point the ADX will begin to turn down, signaling us that the market is no longer trending. Too often, I see people hold onto their trades, hoping the market will come back, long after the ADX has turned.
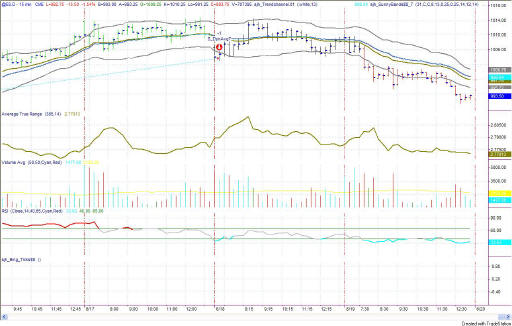
Figure 4a: EMini Intraday 15-minute bars
Yesterday's EMini model gave a sell signal near the beginning of the day, for those of you who have my indicators and can follow along. You might have wondered yesterday just why it gave a sell signal. But today we see why. Thus, the model was short from 1003.70 through to today's close at 993.50-- a nice 10 point move!
RSI on the intraday chart is now in bearish territory, and could go a little deeper before pulling upward. I expect about another half day of negativity.
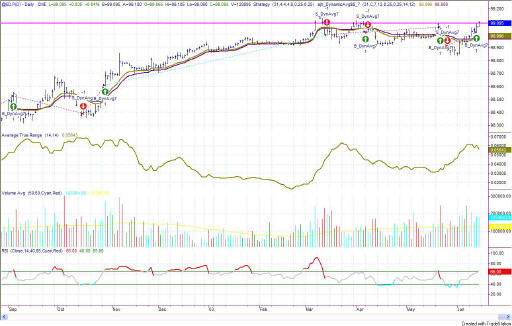
Figure 5a: EuroDollar Daily - Sunday night commentary only
Don't you just hate it when markets get into those choppy sideways periods? There is nothing much you can do but wait for a trend to emerge.
When currencies trend they do so for long periods, and when sideways, ... well, I guess that could go on for a long time as well. Friday's move up left the chart looking like a quadruple top. Unless the EuroDollar breaks above 99.11, then it could continue on repeating this pattern of choppiness, with the downside being at 98.9.
The
current signal on the EuroDollar model is long, from Thursday. It's
not much of a signal yet, but rather a continuation of a long sideways
period.
Stay sharp and on your toes. We have had several up-days in a row, and a correction could come in the near future. But, as long as the markets are going up, they are going up--so I'm sticking with it.
RULES OF THUMB:
0. I keep the chart in Figure 1a on each day's commentary simply to illustrate how much in tandem the 4 indexes I watch actually are. For this reason, I don't always comment on every index. Analysis of one speaks highly for the same analysis for each of the other indexes.
1. When price is pushing the upper Sunny_Bands upward and then eases off and moves back toward the midline, it's time to take profits. If it starts moving up and pushing on the Sunny_Bands again, it's time to get back in. Likewise, if the market is pushing down on the lower Sunny_Band and eases off to move back to the midline, it's time to take profits from the short play.
2. Divergence of the RSI and price is another good time to take profits and wait for a breakout of price before taking a position.
3. When the exchange puts in curbs or trading halts on a large move down, it usually (not always) stops the downward motion. After the market reopens is a good time to take profits from your short position.
4. The market can't go nowhere forever. Eventually, who knows how long it will be, there will have to be a breakout-- one direction or the other.
==<:>==
While it may be true that a picture is worth a thousand words, it is definitely not true that a picture deserves a thousand words.
