The Sunny Side of the Street
SUNDAY
NIGHT - June 22, 2003
Archives of Past
Commentaries . How Did We Do?
Weekend Stock Picks --
CLICK HERE
Figure 1a: COMPARISON: DOW vs SPY vs NASDAQ (Intraday)
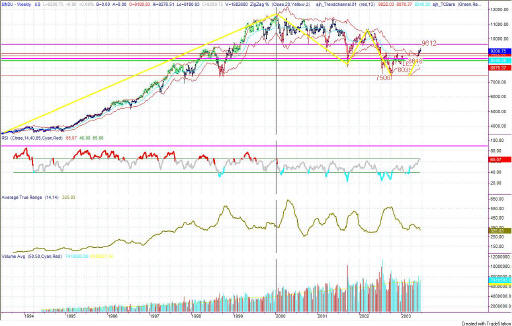
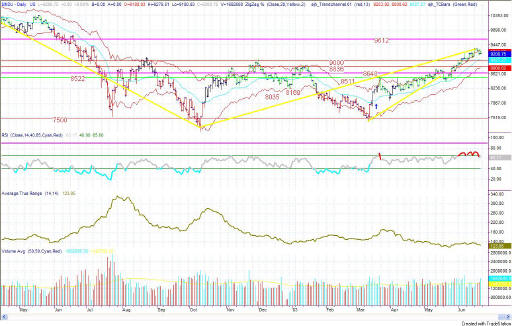
On this long-range chart we have a very symmetrical pattern, looking like a Head-and-Shoulders. It seems apparent from this chart that the symmetry calls for further upside action, at least to the 9612 line on the Dow. That is not to say there won't be any downside activity beforehand, as the markets are always in flux. But, the lengthier prediction would be for the Dow to work its way up to a close near 9612 on the daily chart.
After that, if this complex Head-and-Shoulders plays out like a typical Head-and-Shoulders it should break down below the neckline in a measured move down below 6000. Now that's what I would say as a serious Technical Analyst. But, as an optimist and pragmatic interpreter of the economy, I have to say that I think we are in for continued sideways movement in the markets for a long time to come. The current action reminds me of the markets of the 1960s and 1970s: twenty years of sideways action.
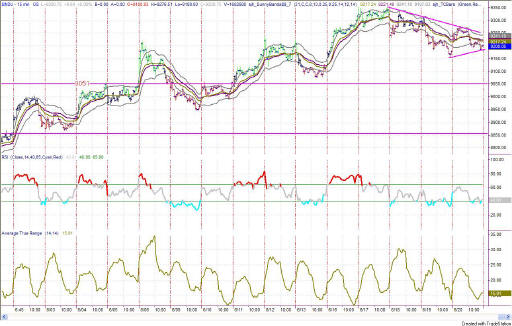
Figure 1d: INDU Intraday 15 minute
In last time's commentary I said:
- "It would not surprise me for the SPY to complete the move down to the bar and then bounce upward from there."
Friday's market action created another Inside Day with the highs of Friday being below the highs of Thursday and the lows of Friday begin higher than the lows of Thursday.
According to Bulkowski, an inside day is not more likely to produce a large move the following day; in fact, just the opposite is true--it is likely to produce another small range day.
In my own studies, a pennant formation, such as that seen in Figure 1d, are not likely to continue the movement to the previous direction (as stated in traditional technical analysis).
Basically, we can't really read anything into an inside day formation.
| EDUCATION is not expensive; lack of education is! | |
| Consider this, how much can you lose on a single trade? How much should you pay for good advice? If you could make $1,000 per month trading advice that cost you $139.95 per month, would it be worth it? That's 7:1 odds! | |
| Subscribe now to The Sunny Side of the Street and SAVE. If you are receiving this commentary as part of the one-week trial and subscribe before the week runs out, your subscription will be only $99.95 per month, for as long as you are a continuous subscriber. If you wait, the regular subscription price is $139.95/month, which is still a great value! | |
| Like the indicators I use in this commentary? If you are a TradeStation user, you can have them on your computer, so you can follow along intraday! | |
| Need a MENTOR? Sunny is available for hourly consultation, or for extended studies. Call (888) 68-SUNNY...that's (888) 687-8669. | |
| How about help using or programming TradeStation? Give us a call. It's what I enjoy the most. |
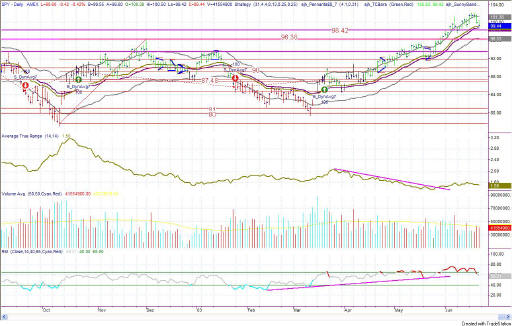
Figure 2a: SPY Daily
Friday's SPY put in a lower day on the daily chart, touching the Sunny_Bands midline. That touch is reason enough to exit long positions and wait for further news on the upside before re-entering. The touching of the midline could become a bounce, but because of the configuration of the RSI, it seems more likely that we are in for another day or two of downside activity.
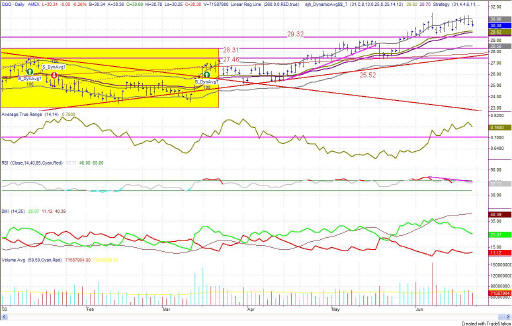
Figure 3a: QQQ Daily
Friday's daily activity was on the downside, but not quite touching the Sunny_Bands midline. If subsequent activity moves down to the midline, the I would expect price to touch (and probably bounce off of) the support line at 29.32. RSI continues to follow the downsloping trendline I drew on the chart last week, and that's part of the reason I am watching for further downside activity.
On the weekly chart of the Dow, in Figure 1b, you can see that RSI has been in the bearish half of the chart since January of 2000 (the vertical line on the chart). According to Brown, as long as the tops of the RSI stay below the 65 level, we are still in a bearish market.
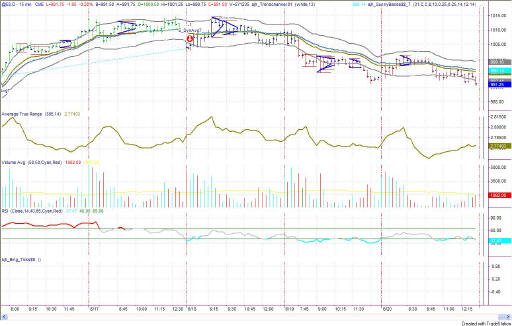
Figure 4a: EMini Intraday 15-minute bars
Friday's intraday move on the 15-minute chart of the EMini was a continuation of the sell signal from 3 days ago. The intraday RSI continues to lag along on the 40 line, confirming the bearish nature of the current short-term activity.
The Pennant formations clustered around the 1000 level on the EMini, indicating serious trader doubts about paying more than 1000 for the EMini.
The next Attractor looks like support at the 985 level, which is the most likely direction and price pivot for the next move.
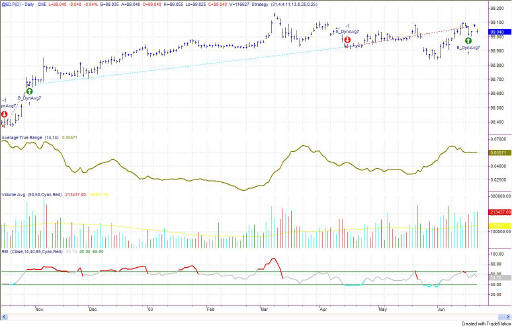
Figure 5a: EuroDollar Daily - Sunday night commentary only
The
current signal on the EuroDollar model is long, from 3 days ago. It's
not much of a signal yet, but rather a continuation of a long sideways
period. The RSI has been unable to reach above the 65 line
demonstrating bullishness, nor has it gone very low demonstrating
bearishness. Basically, we are still looking at a sideways market.
Stay sharp and on your toes. We have had several up-days in a row, and a correction could come in the near future. But, as long as the markets are going up, they are going up--so I'm sticking with it.
RULES OF THUMB:
0. I keep the chart in Figure 1a on each day's commentary simply to illustrate how much in tandem the 4 indexes I watch actually are. For this reason, I don't always comment on every index. Analysis of one speaks highly for the same analysis for each of the other indexes.
1. When price is pushing the upper Sunny_Bands upward and then eases off and moves back toward the midline, it's time to take profits. If it starts moving up and pushing on the Sunny_Bands again, it's time to get back in. Likewise, if the market is pushing down on the lower Sunny_Band and eases off to move back to the midline, it's time to take profits from the short play.
2. Divergence of the RSI and price is another good time to take profits and wait for a breakout of price before taking a position.
3. When the exchange puts in curbs or trading halts on a large move down, it usually (not always) stops the downward motion. After the market reopens is a good time to take profits from your short position.
4. The market can't go nowhere forever. Eventually, who knows how long it will be, there will have to be a breakout-- one direction or the other.
==<:>==
While it may be true that a picture is worth a thousand words, it is definitely not true that a picture deserves a thousand words.
