The Sunny Side of the Street
WEDNESDAY
NIGHT - June 25, 2003
Archives of Past
Commentaries . How Did We Do?
Weekend Stock Picks --
CLICK HERE
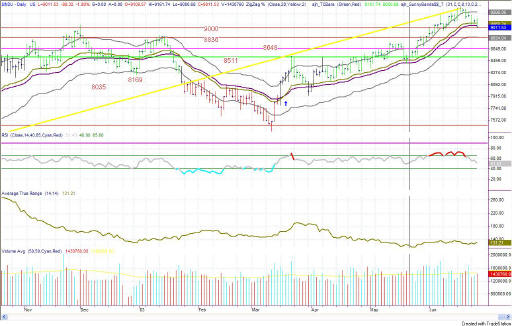
Figure 1a: COMPARISON: DOW vs SPY vs NASDAQ (Intraday)
In last time's commentary I said:
- Because that number is lower that the current Sunny_Band midline I believe the SPY is likely to see some continued downside action, possibly even down to the next Attractor at 96.38.
Today's SPY opened at 98.53 and closed at 97.54. That's a tidy little 0.99 on a short play!
The Dow opened at 9109 and closed down at 9011, down 98 points. We are getting back into the 100 point a day moves now, and the Average True Range seems to be picking up just a little bit of steam. The steam, however, seems favorable to the downside, not the continuation of the up movement just yet.
We have probably started the 4th wave, by my count, and should move in a large triangle as I said in last Sunday night's commentary.
Because price on the Dow is below the Sunny_Bands midline, I am on the sidelines, waiting to see which way the other shoe drops. Will it touch the lower band and call for a short? Or, will it bounce and go back up? Only the market and the bands will tell us.
| EDUCATION is not expensive; lack of education is! | |
| Consider this, how much can you lose on a single trade? How much should you pay for good advice? If you could make $1,000 per month trading advice that cost you $139.95 per month, would it be worth it? That's 7:1 odds! | |
| Subscribe now to The Sunny Side of the Street and SAVE. If you are receiving this commentary as part of the one-week trial and subscribe before the week runs out, your subscription will be only $99.95 per month, for as long as you are a continuous subscriber. If you wait, the regular subscription price is $139.95/month, which is still a great value! | |
| Like the indicators I use in this commentary? If you are a TradeStation user, you can have them on your computer, so you can follow along intraday! | |
| Need a MENTOR? Sunny is available for hourly consultation, or for extended studies. Call (888) 68-SUNNY...that's (888) 687-8669. | |
| How about help using or programming TradeStation? Give us a call. It's what I enjoy the most. |
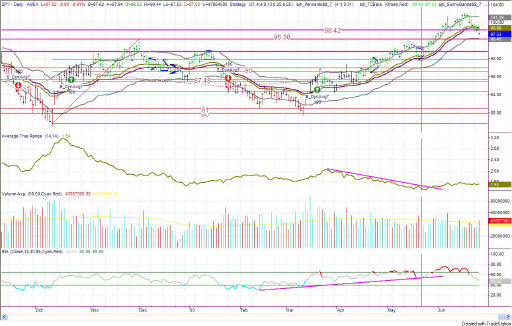
Figure 2a: SPY Daily
Today's SPY pushed on through the 98.42 Attractor that I have been talking about and headed on for the Attractor at 96.38, which I mentioned last time. Look out below! There's no stopping it now until it reached that Attractor line. Then it will show us whether it wants to bounce or continue dropping.
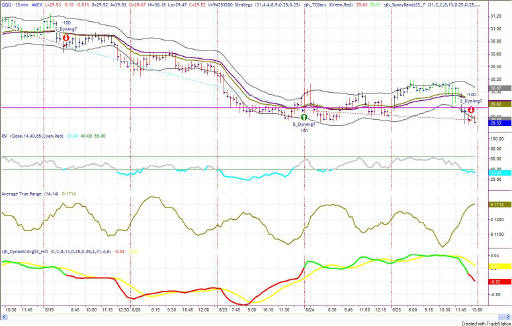
Figure 3a: QQQ Daily
Today's drop on the QQQ model wasn't enough to cause the signal to turn to a sell until late in the afternoon. From a mathematical perspective the market just looked like a continuation of a sideways pattern. But, if you had been following along on my Technical Analysis of the markets, you would have seen the short play coming from yesterday.
The formation of the RSI, still in the bearish range, with today's crossover of the Sunny_Dynamic_Average Histogram crossing over the yellow moving average line mid day makes me think that some more downside movement is still ahead of this market.
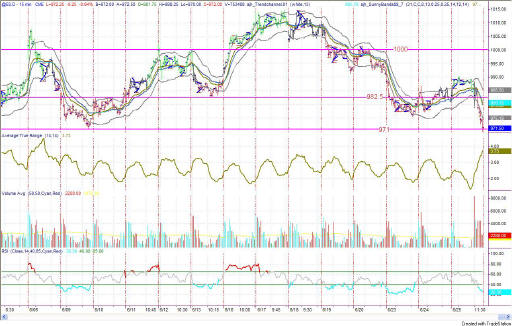
Figure 4a: EMini Intraday 15-minute bars
In last time's commentary I said: "It looks from today's action that tomorrow could be another downward day." Let me say that again. Now it looks like a Head & Shoulders pattern with room on the downside to 960. Stopping at 960 would also be hitting the bottom Sunny_Band, where the market should take a bounce. The measured move on the H&S would take it as low as 940, but somehow I don't think that is going to happen.
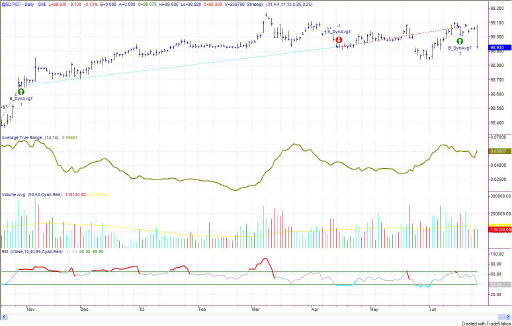
Figure 5a: EuroDollar Daily - Sunday night commentary only
The
current signal on the EuroDollar model is long, from 3 days ago. It's
not much of a signal yet, but rather a continuation of a long sideways
period. The RSI has been unable to reach above the 65 line
demonstrating bullishness, nor has it gone very low demonstrating
bearishness. Basically, we are still looking at a sideways market.
Stay sharp and on your toes. We have had several up-days in a row, and a correction could come in the near future. But, as long as the markets are going up, they are going up--so I'm sticking with it.
RULES OF THUMB:
0. I keep the chart in Figure 1a on each day's commentary simply to illustrate how much in tandem the 4 indexes I watch actually are. For this reason, I don't always comment on every index. Analysis of one speaks highly for the same analysis for each of the other indexes.
1. When price is pushing the upper Sunny_Bands upward and then eases off and moves back toward the midline, it's time to take profits. If it starts moving up and pushing on the Sunny_Bands again, it's time to get back in. Likewise, if the market is pushing down on the lower Sunny_Band and eases off to move back to the midline, it's time to take profits from the short play.
2. Divergence of the RSI and price is another good time to take profits and wait for a breakout of price before taking a position.
3. When the exchange puts in curbs or trading halts on a large move down, it usually (not always) stops the downward motion. After the market reopens is a good time to take profits from your short position.
4. The market can't go nowhere forever. Eventually, who knows how long it will be, there will have to be a breakout-- one direction or the other.
==<:>==
While it may be true that a picture is worth a thousand words, it is definitely not true that a picture deserves a thousand words.
